2020-05-25 – The TSX Composite Index May Have Little Upside Potential Unless This Happens
The four largest sectors inside the TSX Composite Index include; Financials (31.7% of the Index), Energy (19 % of the index), Materials (14.1% of the Index), and Industrials (11.2% of the Index). For additional information on the sector composition of the TSX, please see the following link;
As these four sectors make up 68.5% of the index, advancement or declines in the TSX can largely be attributed to one or more of these sectors.
Within our Heat Map, we note that the TSX Financial Sector is the weakest sector inside the TSX with a Market Model Ranking (MMR) of only 16 as shown below;
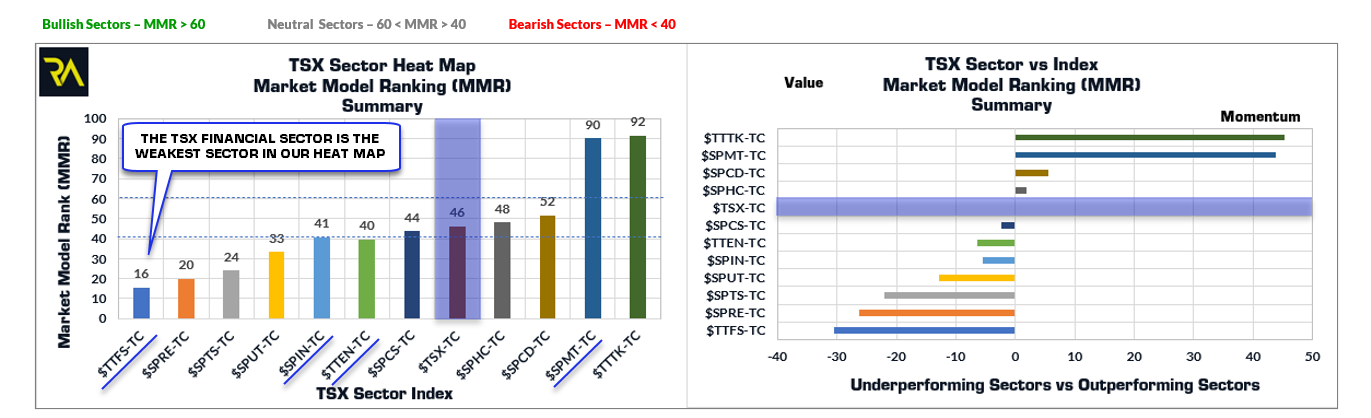
As the TSX Financial Sector is lagging, that means that almost 1/3 of the TSX Index is weighing the TSX down and hindering it’s ability to rise.
During the February 2020 market crash, the TSX Financial Sector produced a drawdown of -40.14% as shown below.
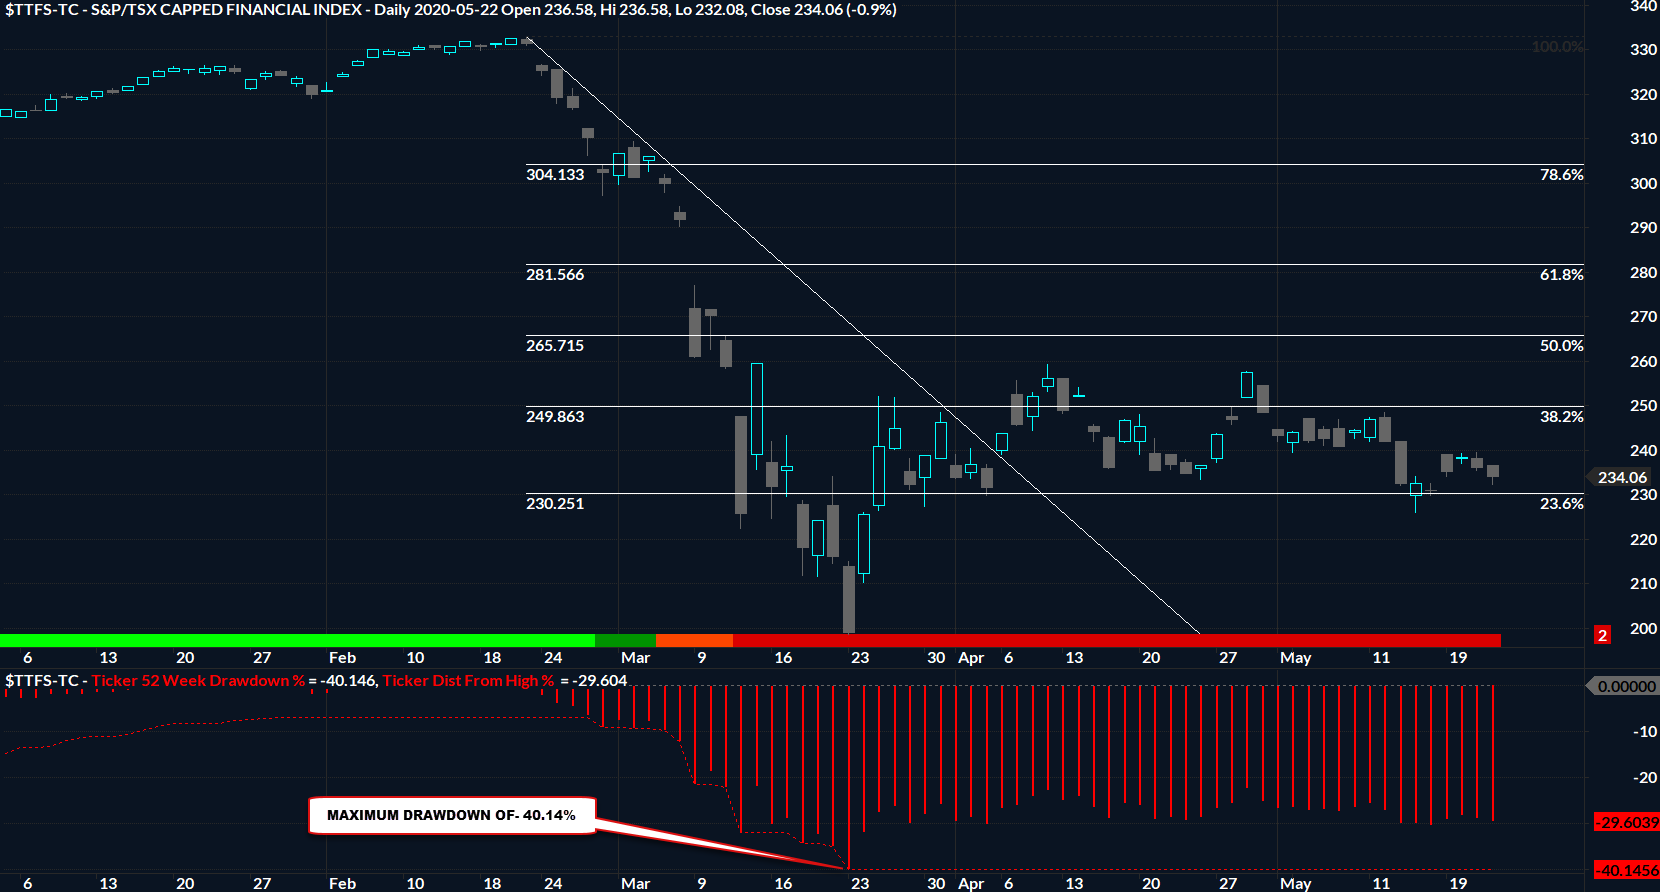
While many other sectors have rebounded and may be on their way to recovery, note that the TSX Financial Index as not yet broken above its 50% retracement as defined by the February 21st high to the March 23, 2020 low. Simply from a price perspective, this weak bounce has led to the TSX Financial Sector being the weakest sector inside the Composite Index.
At Riverside, we have a vast database of Market Breadth Indicators for the following markets;
- New York Stock Exchange (NYSE);
- Nasdaq;
- S&P 1500;
- US Sectors;
- US Dow Jones Industry Groups;
- TSX;
- TSX Sectors;
- Global Markets;
- EAFA Markets;
- Emerging Markets;
In total we have created and monitor 186 Breadth Index’s.
Of particular interest for this blog post is our breadth indicators for the TSX Financial Sector. The chart below contains two windows with a number of panes within each window. The window on the left are standard indicators we follow, while on the right, we have illustrated our % Stocks Above an Exponential Moving Average Breadth Indicators for the TSX Financial Sector. These three Breadth Indicators make up a portion of the 8 Breadth Indicators we follow for each area of the market.
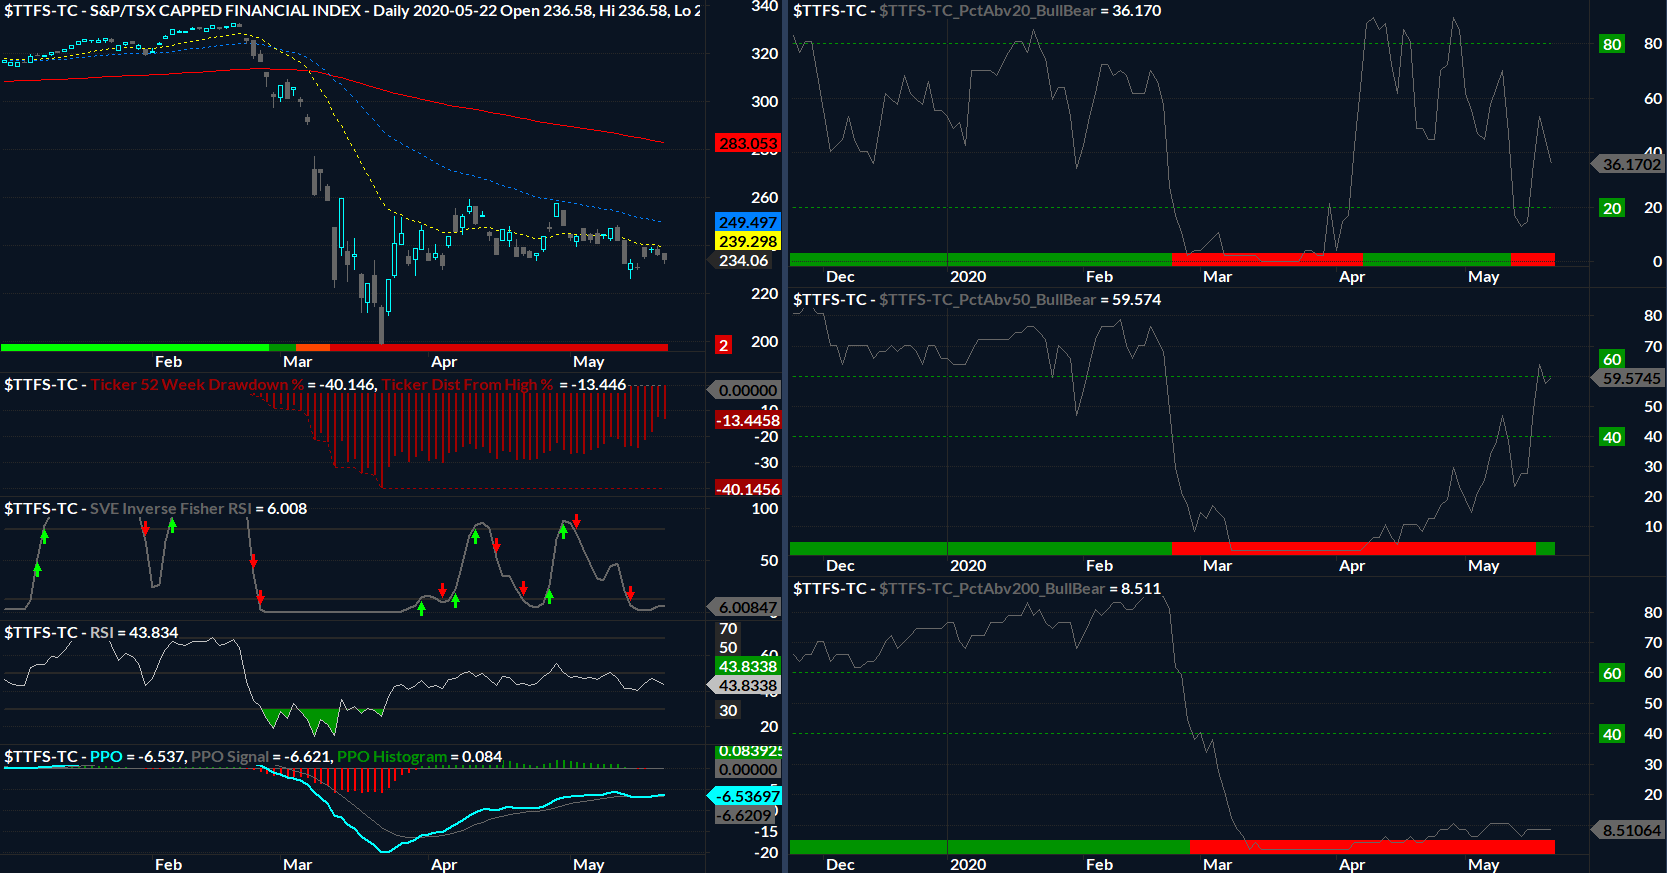
Starting with the % Stocks above the 20-day EMA (PctAbv20), right window, top pane, the price surge in the TSX Financial Index from the March 23, 2020 low to the April 9, 2020 high was accompanied by a surge in this indicator above 80%. This is Bullish in the short term, however, note that the indicator has continued to decline since April 9, 2020. At a minimum, the TSX Financial Sector needs this shorter term breadth indicator to surge north of 80% again if the Financial Sector is going to stage a rally. Currently with this indicator falling and showing a decline in participation, this implies a re-test of the recent lows on May 14th.
Next, the % Stocks above the 50-day EMA (PctAbv50), right window, middle pane, has briefly crossed above 60% and has now marginally weakened to 59.57%. Giving credit where credit is due, the surge across the 60% threshold is encouraging as it shows broad participation over this time frame. However, for the sector to show strength, we are looking for this indicator to show sustained positioning above the 60% threshold. This has not happened yet.
Finally, the % Stocks above the 200-day EMA (PctAbv200), right window, bottom pane, shows that only 8.5% of the stocks inside the TSX Financial Sector reside above their 200-day EMA’s. Following a -40% decline in the sector, this is not surprising to see the weakness in breadth on this time frame. For the sector itself to climb back above it’s 200-day EMA would require north of a 40% advancement from the March 23, 2020 lows. This has not happened yet. Further, the PctAbv200 is still showing the technical damage to the sector. For the sector to be on the mend, we would want to see the PctAbv200 above and sustained above 60%. Again, this has also not happened yet.
Conclusions
The TSX Composite Index may have little upside potential unless the Financial Sector can repair itself following the February 2020 crash.
A brief review of our breadth indicators shows that while there has been a surge in participation following the March 23, 2020 low, this surge is not nearly enough to lift the Financial Index higher with only 8% of it’s stocks above the 200-day EMA. With our Heat Map MMR residing at 16, this indicates caution for the TSX Financial Sector until market conditions can improve.
With the PctAbv20 falling once again, it would not be surprising to see the TSX Financial Index re-test the May 14, 2020 lows at 225.91 or it’s 23.6% retracement. Breaking below the May 14, 2020 lows, would increase the probabilities of re-testing the March 23, 2020 lows.
Between the May 14, 2020 lows and the April 29th highs, investors can expect whipsaw in this sector. In this range, traders can capitalize on swing highs and lows for shorter term opportunities.
While market conditions can and will change over time, a rise above the April 29th highs, would trigger broader participation and continue the healing process of the sector itself. Investors can use this level as a benchmark and increased odd’s for further price advancement.
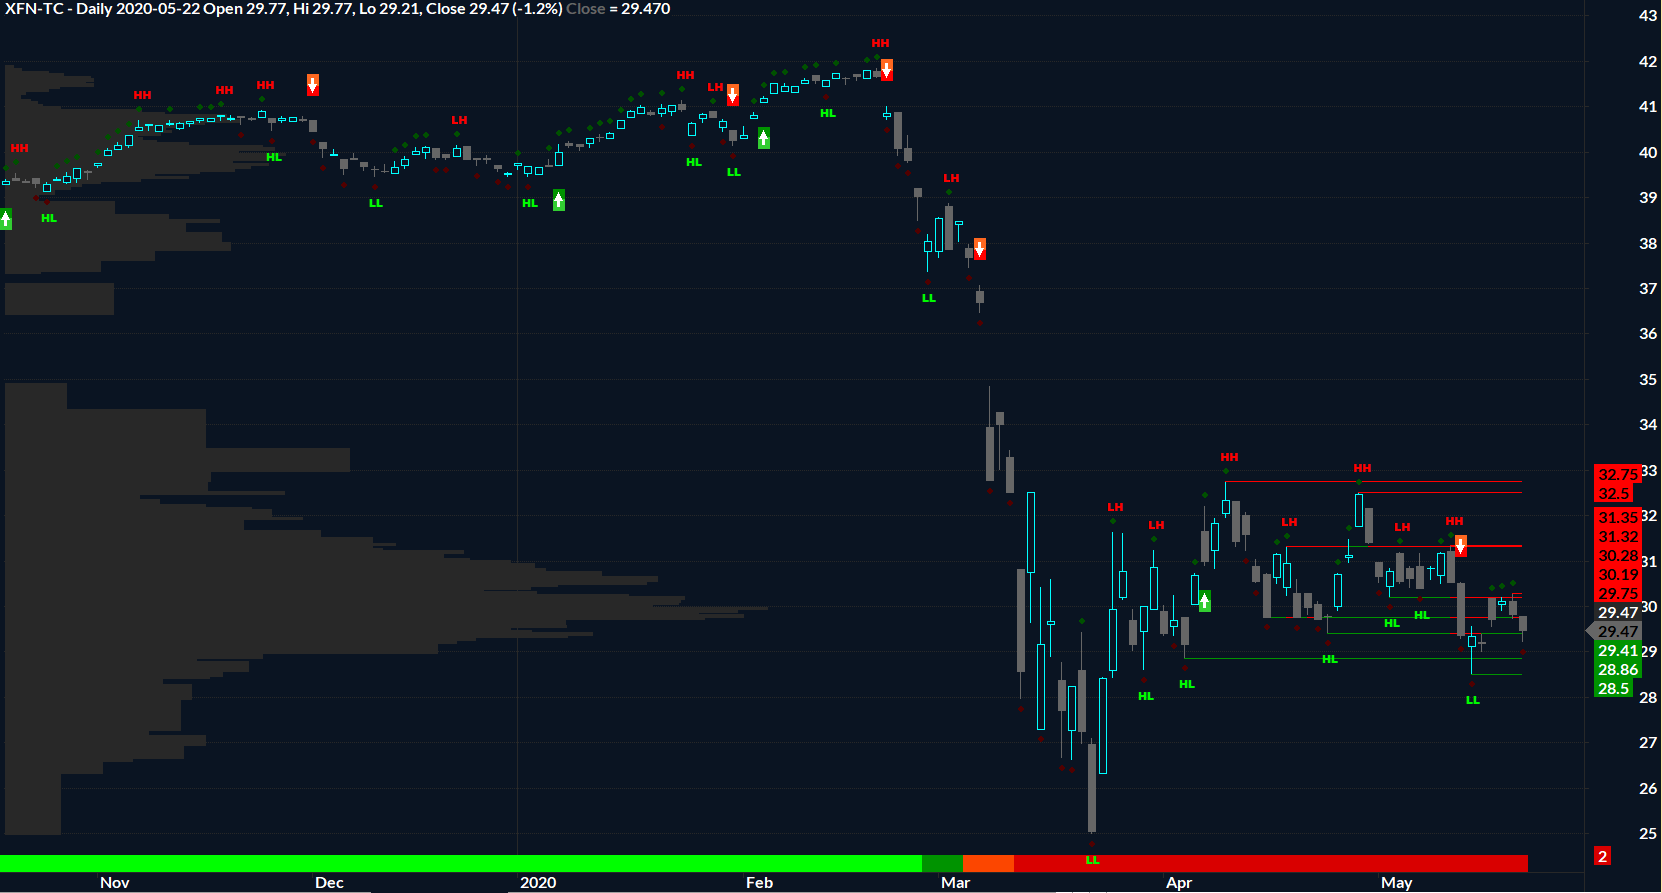
The TSX Financial Index/Sector may be tracked through the XFN-TC ETF. Key levels on this ETF have been identified by our Auto Support-Resistance Tool below;
Please note, as Financials are the weakest sector inside the TSX, I currently do not hold positions in this sector.
Riverside Analytics Inc (Riverside), its employees or its directors are not a registered financial advisers and do not provide investment advice or recommendations directed to any particular subscriber or in view of the particular circumstances of any particular person. Subscribers to Riverside or any other persons who buy, sell or hold securities should do so with caution and consult with a registered financial adviser before doing so. At various times, the publishers and employees of Riverside may own, buy or sell the securities discussed for purposes of investment or trading. Riverside and its publishers, owners, and agents are not liable for any losses or damages, monetary or otherwise, that result from the content of Riverside. Past results are not necessarily indicative of future performance. You are advised to discuss your specific requirements with an independent financial adviser.