MACRO ENVIRONMENT REVIEW AND ANALYSIS
The economy drives corporate earnings, which drives the stock market in the long term. As a result, bull markets usually coincide with economic expansions, and big bear markets usually coincide with recessions. Since the stock market tends to peak before recessions begin, we need to look at leading economic indicators, which also deteriorate before recessions begin. This doesn’t mean that the stock market’s exact top cannot occur before macro starts to peak. This happened in January 1973, when the stock market peaked a few months before macro started to deteriorate. However, the biggest part of bear markets always occur after macro has deteriorated significantly as shown below;

Macro Indicators can generally grouped into one of the following categories;
- National Income and Expenditures;
- Population, Employment and Labor Markets;
- Production and Business Activity;
- Money, Banking and Finance;
- Prices;
While we monitor in excess of 30 Macro Indicators each month, we strive to provide a simple and concise overview of the Macro Environment for our members. To assess the Weight of the Evidence through a diverse and condensed list of indicators, we have hand selected the 10 Macro Indicators below;
- Civilian Unemployment Rate (UNRATE);
- KC Fed Labor Market Conditions Index, Momentum Indicator (FRBKCLMCIM);
- Industrial Production Index (INDPRO);
- Motor Vehicle Retail Sales: Heavy Weight Trucks (HTRUCKSSAAR);
- Advance Retail Sales (RRFS);
- Housing Starts (HOUST);
- B of AML US High Yield CCC or Below Option-Adjusted Spread (BAMLH0A3HYC);
- National Financial Conditions Index Credit Subindex (NFCICREDIT);
- 10-Year Treasury Constant Maturity Minus 2-Year Treasury Constant Maturity (T10Y2Y) and;
- S&P 500 Valuations.
MACRO INDICATOR ANALYSIS EXAMPLE
Below is an example of how we monitor and assess the Macro Indicators for future clues on market direction.
INDUSTRIAL PRODUCTION INDEX (INDPRO) – ANNUAL CHANGE
MEASURES THE RAW VOLUME OF GOODS PRODUCED FROM MANUFACTURING COMPANIES
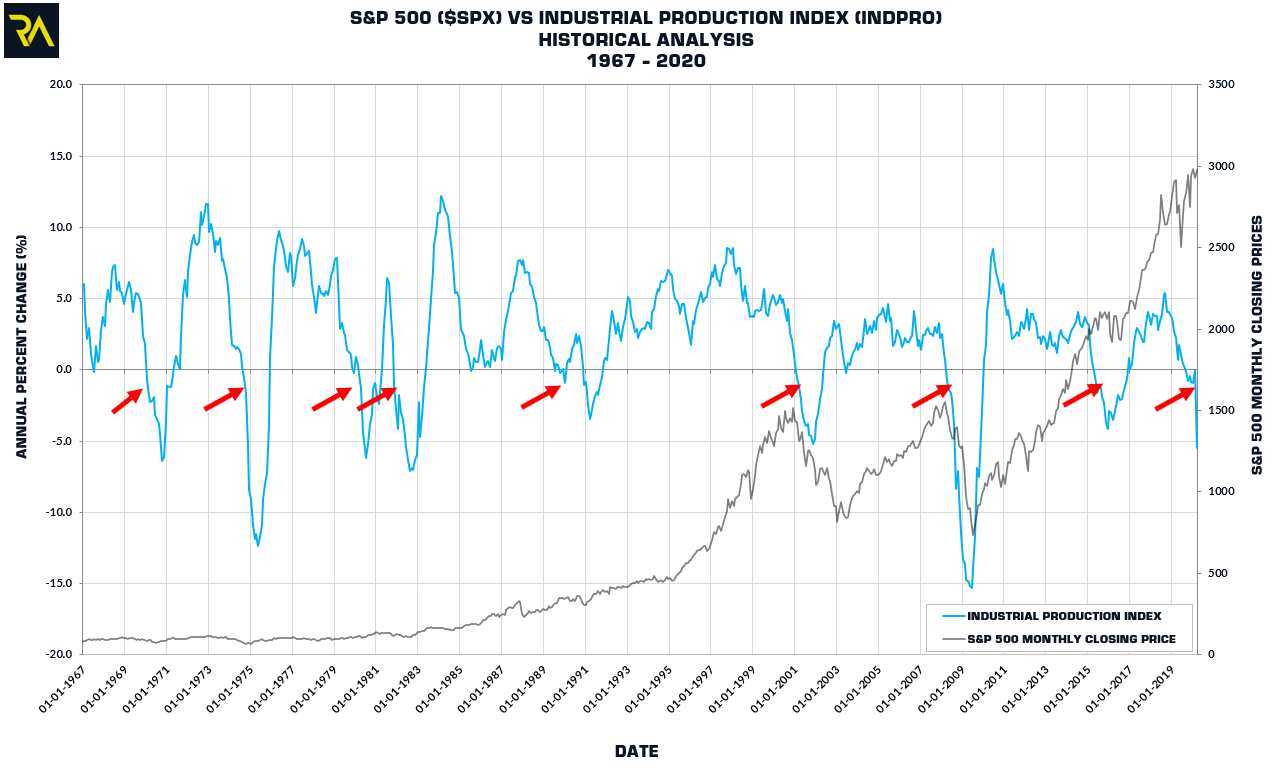
While the Industrial Production Index resides above zero, generally the index indicates increasing industrial production and strong business activity. Therefore this would represent strong economical conditions. Large bullish trends in the S&P 500 have been correlated with the Industrial Production Index residing above zero.
While the Industrial Production Index resides below zero, generally the index indicates decreasing industrial production and weak business activity. Therefore this would represent weak economical conditions. Corrections and bear markets in the S&P 500 have been correlated with the Industrial Production Index residing below zero.
The Industrial Production Index fell below zero in September of 2019. While the S&P 500 continued to rise into all time highs printed on February 19, 2020, as a leading indicator the Industrial Production Index provided investors advanced warning of waning economic conditions and future price volatility. This volatility was finally recognized with a -13.78% decline (measured on a closing basis) during the week of February 24th-28th, 2020.
Below is a full list of Macro Indicators Reviewed each month by Riverside staff.
| NO | MACRO INDICATOR | CATEGORY | SUBCATEGORY |
| 1 | Initial Jobless Claims | Population, Employment and Labor Markets | Labor Conditions |
| 2 | Continued Jobless Claims | Population, Employment and Labor Markets | Labor Conditions |
| 3 | Civilian Unemployment Rate | Population, Employment and Labor Markets | Labor Conditions |
| 4 | KC Fed Labor Market Conditions Index, Momentum Indicator | Population, Employment and Labor Markets | Labor Conditions |
| 5 | All Employees: Total Non-farm Payrolls/Civilian Labor Force | Population, Employment and Labor Markets | Labor Conditions |
| 6 | Industrial Production | Production and Business Activity | Production |
| 7 | Motor Vehicle Sales: Heavy Trucks | Production and Business Activity | Sales |
| 8 | Advance Retail Sales | Production and Business Activity | Sales |
| 9 | Non-financial Corporations:Unit Profits | Production and Business Activity | Profits |
| 10 | Corporate Profits after Tax | Production and Business Activity | Profits |
| 11 | New Private Housing Units Authorized by Building Permits | Production and Business Activity | Housing and Urban Development |
| 12 | Housing starts: Total New Privately Owned Housing Units Started | Production and Business Activity | Housing and Urban Development |
| 13 | Monthly Supply of Houses | Production and Business Activity | Housing and Urban Development |
| 14 | New One Family Houses Sold | Production and Business Activity | Housing and Urban Development |
| 15 | Housing Starts: Total New Privately Owned Housing Units Started / Civilian Labor Force | Production and Business Activity | Housing and Urban Development |
| 16 | High Yield Spreads | Money, Banking and Finance | Credit Conditions |
| 17 | Financial Conditions Index | Money, Banking and Finance | Credit Conditions |
| 18 | Bank Tightening Standards | Money, Banking and Finance | Credit Conditions |
| 19 | Loan Delinquency Rates | Money, Banking and Finance | Credit Conditions |
| 20 | Yield Curve – 10-yr less 3-month | Fixed Income | Yield Curve |
| 21 | 10-yr less 2-year | Fixed Income | Yield Curve |
| 22 | Price to Earnings (P/E) | Valuations | Price to Earnings |
| 23 | Shiller P/E | Valuations | Price to Earnings |
| 24 | Earnings Per Share | Valuations | Earnings |
| 25 | Reported Earnings vs Forecast | Valuations | Earnings |