RIVERSIDE’S SEASONAL PROFIT EXPLORER (SPE)
At Riverside our systematic approach is data dependent. We have a very unique set of tools to help navigate the market including;
- Portfolio Shield – helps us define market risk;
- Heat Map and Associated Sentiment tools – identifies the strength and movements of the markets and;
- Market Breadth Metrics – identifies the internal health of the markets.
To compliment the above tools, we complete various Historical Price Analysis’s to provides a frame of reference for future expected returns based on past price behavior. These Historical Price Analysis’s, in essence, act like a set of headlights whereby illuminating just enough of the road ahead to see the twists and turns. While our Historical Price Analysis is generally limited to select ticker symbols we wanted a way to illuminate the road ahead for all ticker symbols within our database. To do this, we turned to Seasonality.
Seasonality is the tendency for securities to perform better during some time periods and worse during others.
We have developed an algorithm to analyse monthly price data. This algorithm allows us to see the seasonal price fluctuations for all ticker symbols within our database.
We have been able to condense this information into a simple spreadsheet format for Investors and Traders to use. This information can be sorted on a monthly basis to identify ticker symbols that have historically performed well in the past. We believe our Seasonality Profit Explorer is a great addition to our suite of tools whereby illuminating the road ahead and ultimately stacking the odd’s in our favor.
Currently our Seasonality Profit Explorer (SPE) provides the following monthly metrics for all ticker symbols;
- Look back of up to 20-years of Historical Data;
- Calculated Monthly returns;
- Number of Cases (i.e months);
- Number of Positive Cases;
- Percentage of Positive Cases;
- Average Return (%);
- Minimum Return (%);
- Maximum Return;
By using our Seasonality Profit Explorer, we can quickly assess monthly historical performance on Major Market Index’s, Sectors, Industry Groups, ETF’s, individual stocks, etc at a high level. The image below illustrates Major Asset Class historical price behavior for the month of July.

At a quick glance, the image above identifies the percentage of months an asset has produced a positive return and the magnitude of that return over a given month. We classify this view as our “100-ft” view whereby allowing us to absorb a vast amount of information about major asset classes. Should a particular asset class be of particular interest, we can re-direct our focus to the ground level and dive into ticker symbol specifics. The image below shows the true power of our Seasonality Profit Explorer on the S&P TSX Capped Composite Index ($TSX-TC) with the month of July in focus;
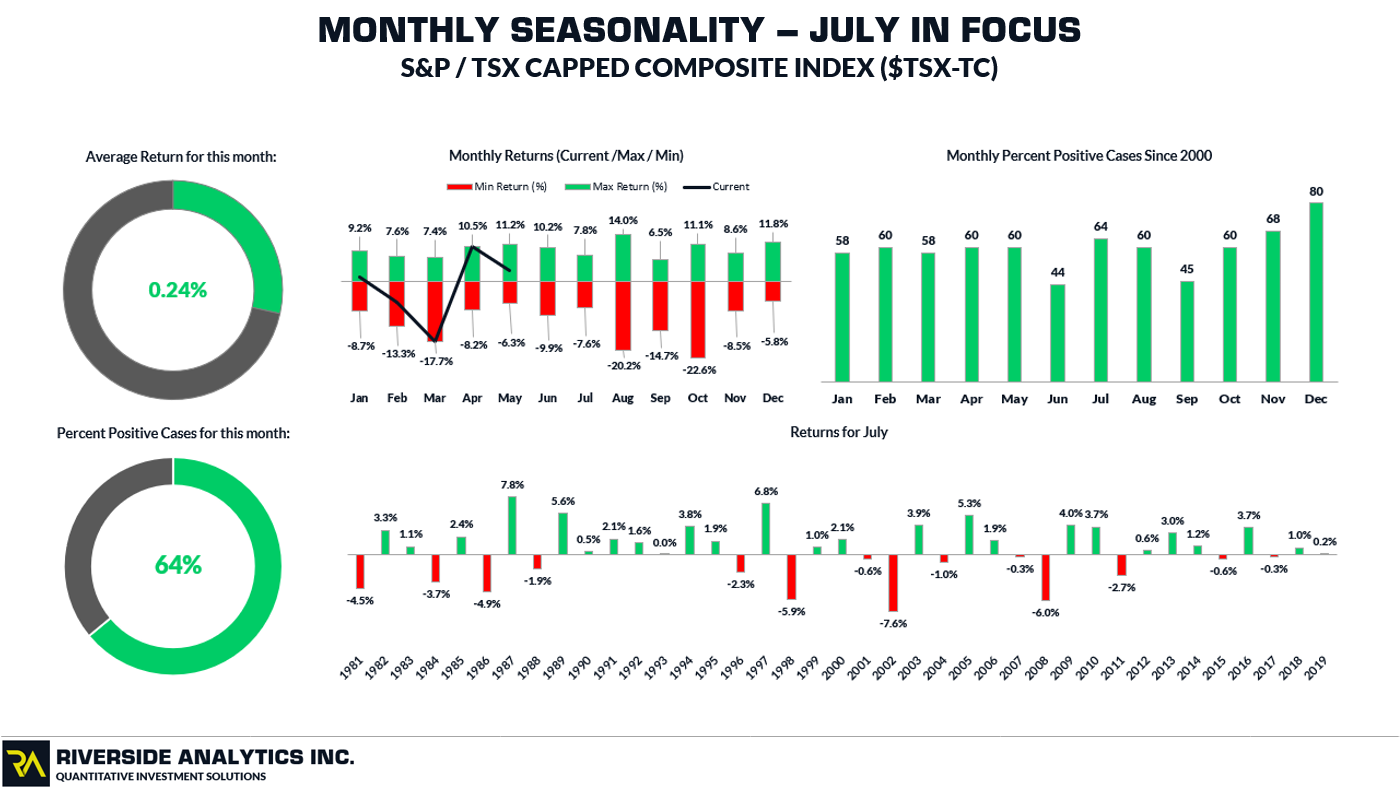
Based on a quick visual inspection, we can see that the S&P TSX Capped Composite Index ($TSX-TC) has produced positive monthly returns since 1981, 64% of the time with an average return of 0.24%. Noting that there may be a good probability of positive returns for the month of July in the TSX, we can dive many layers further including assessing historical tendencies associated with individual sectors, industry groups, stocks and ETF’s. The image below shows the results of our Seasonality Profit Explorer on the individual TSX Sectors for the month of July. The sectors have been sorted based on Percent Positive Cases (Highest to Lowest).
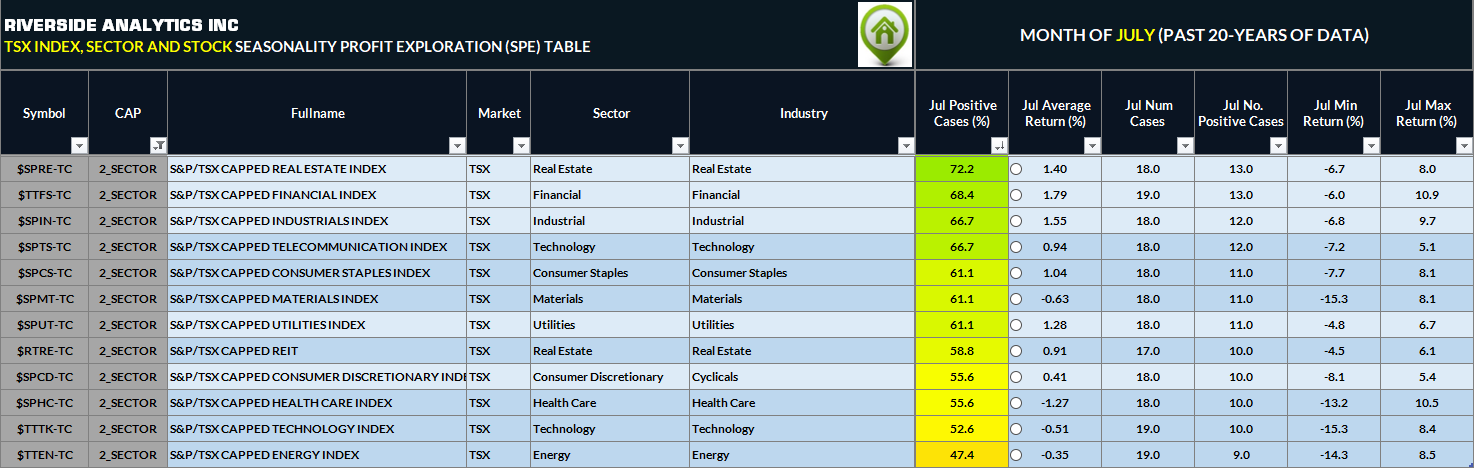
A quick inspection reveals that Real Estate, Financials and Industrials have the strongest Seasonal Tendencies for the month of July over the last 20-years with Average Returns of 1.40%, 1.79% and 1.55% respectively. Given the strong seasonal tendencies of these three sectors, we can utilize our other powerful tools outlined in the General Overview Tab of the Website to identify specific opportunities in the top performing sectors while managing risk in sectors that have historical under-performed.
Again, this is yet another way that we help stack the odd’s in your favour!