QUANTITATIVE MARKET ANALYSIS
Quantitative Analysis is only but one of a few ways that we analyze the markets each and every week. Each week, we use a Weight of the Evidence Approach thereby complementing various Quantitative Analysis with Intermarket Technical Analysis, Market Breadth and Trend Following. By assessing the Weight of the Evidence, we can develop an un-biased thesis on the markets and transact accordingly based on the current facts in hand. Further, each week we can ask whether current price action aligns with this thesis.
- When the answer is yes, we can continue along our current path.
- When the answer is no, we must question the validity of the thesis and make alternate arrangements to our plan.
While the above approach is specific to the technical side of the market, similar concepts can be applied to market fundamentals as well.
This section of the website provides an overview of why we choose to use Quantitative Analysis as a part of our overall approach and how this style of analysis can be used in the markets to both grow and protect portfolios. The commentary provided below has been referenced from our e-book completed in November 2019.
If the overview below is of interest, please contact us at XXX@riversideanalyticsinc.com to receive a complimentary copy of the ebook.
QUANTITATIVE MARKET ANALYSIS : TRULY STACKING THE ODDS IN YOUR FAVOR
HISTORICAL INVESTOR RETURNS
Through time it has been well documented by several sources that the average American Investor under performs the market by a broad margin. One of the more known resources documenting this topic is the Dalbar’s Quantitative Analysis of Investor Behavior study. The study showed just how poorly investors perform relative to market benchmarks over time and the reasons for that under-performance. Figure 1 (Roberts, 2017) illustrates average American investor returns for equity funds, asset allocation funds and Fixed income funds on the left vs actual returns in the S&P 500 and Barclay’s Aggregate Bond Index fund.
Figure 1: Average Investor Returns vs the Market1
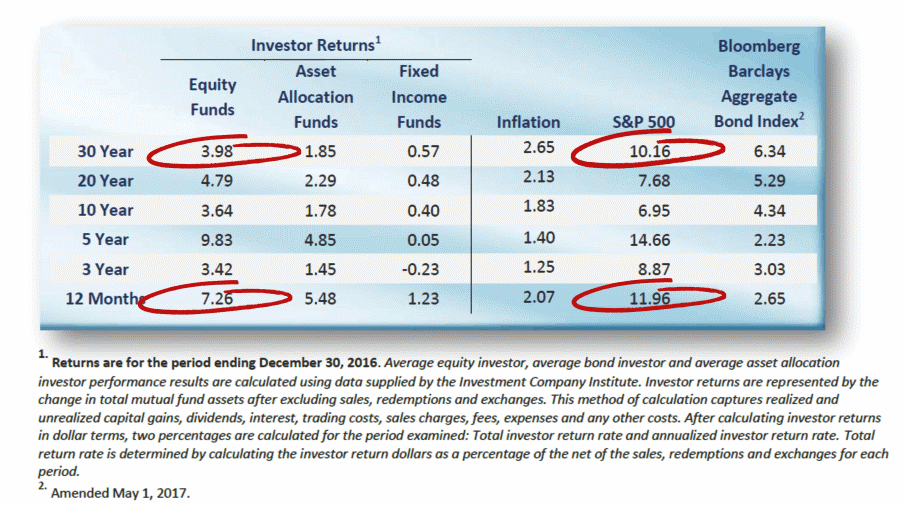
The 2017 Dalbar Report2 notes that there are three primary reasons why average investor under-performs over time including; Capital not available to invest (25%), Capital needed for other purposes (25%) and Psychological factors (50%). While capital is certainly needed to invest in the markets, the Psychological influence the market has on investor psyche is often over-looked and under rated.
Generally speaking, the market has three possible configurations to which price action may follow. Price can be trending higher; price can be trending lower or price can be contained within a consolidation range. Within each one of these three price configurations, a cycle of market emotions tend to occur as shown in Figure 2 below;
INVESTOR PSYCHOLOGY
Figure 2: The Cycle of Market Emotions3
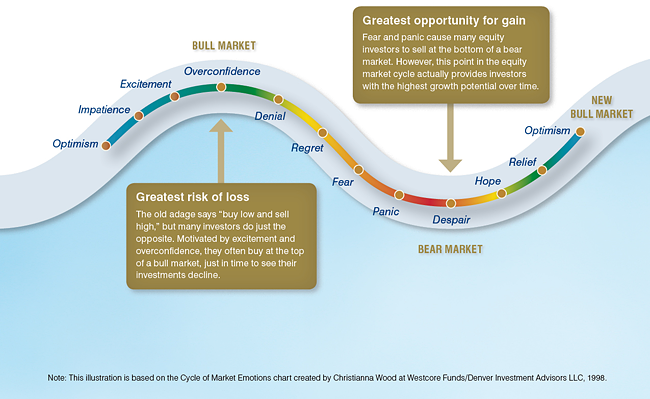
Triggering such emotions itself does not produce under-performance. Rather, investor behavior following these emotions can be attributed to under-performance. Investor behavior is not simply buying and selling at the wrong time, it is the psychological traps, triggers and misconceptions that cause investors to act irrationally. That irrationality leads to buying and selling at the wrong time which leads to under-performance.
HISTORICAL PRICE PATTERNS
Price patterns in the market reflect investor sentiment and behavior in response to contributing factors including economic data, fundamental data and the news. As an individual investor we have access to historical price data on the market from varying sources. Figure 3 below illustrates price patterns and fluctuations of the S&P 500 to date in 2019;
Figure 3: S&P 500 Price Patterns and Fluctuations

We can see that price does not move up or down in straight lines, rather there is an ebb and flow to the market over time. This concept is applicable to any ticker symbol in any market and any time frame.
PRICE PATTERNS AND INVESTOR PSYCHOLOGY
Since we have access to vast amounts of historical price information, from a Psychology perspective, it would be helpful to understand how the market reacted to various situations in the past. We can simply ask the question, what has actually happened in the market based on the criteria as noted above. Is this swing high a bear market top? Is this swing low the low that propels us higher?
Despite there being a swing high in the market, we also know that not all swing highs lead to bear market environments. In fact, swing highs can actually lead to great buying opportunities. One of the ways we can assess market conditions is to assess similar instances in time where similar price pattern emerged.
Why study historical price behavior? I offer three famous quotes below to answer this question;
- “History doesn’t repeat itself, but it does rhyme” -Mark Twain
- “People and psychology do not change” – Gil Blake, Market Wizards
- “Those who cannot learn from history are doomed to repeat it” – George Santayana
By assessing what has happened based on X,Y or Z we can observe a realistic range historical price behavior. From here we can develop realistic expectations of possible price direction and the fluctuation of price overtime. Further we can maintain maximum flexibility in the markets and reduce emotions/biases.
LISTENING WITH OUR EYES
Occasionally in the market, we experience periods of strong buying and selling pressure resulting in rapid movements in price over a defined period of time. These occurrences often provide key insights into the market’s future direction. To quantify this statement, let’s look at an example of strong buying pressure that occurred on the S&P 500 Large Cap Index ($SPX) in January 2019. Figure 4 illustrates the ROC(16) on $SPX;
Figure 4: S&P 500 – 16 Day Rate of Change exceeds 12%

On January 17, 2019 the ROC(16) exceeded 12%. We can see that a normal range of fluctuation on the indicator from January 2018 to January 2019 would reside between +6 to – 8. Seeing a reading of +12% falls within the category of strong buying pressure that has not been experienced over the past year. Periods of strong buying pressure like this are rare as the previous time this signal occurred was on October 27, 2011.
Figure 5 illustrates the results of the backtest on the S&P 500.
Figure 5: S&P 500 – ROC(16) > 12 – Expanded Backtest Results
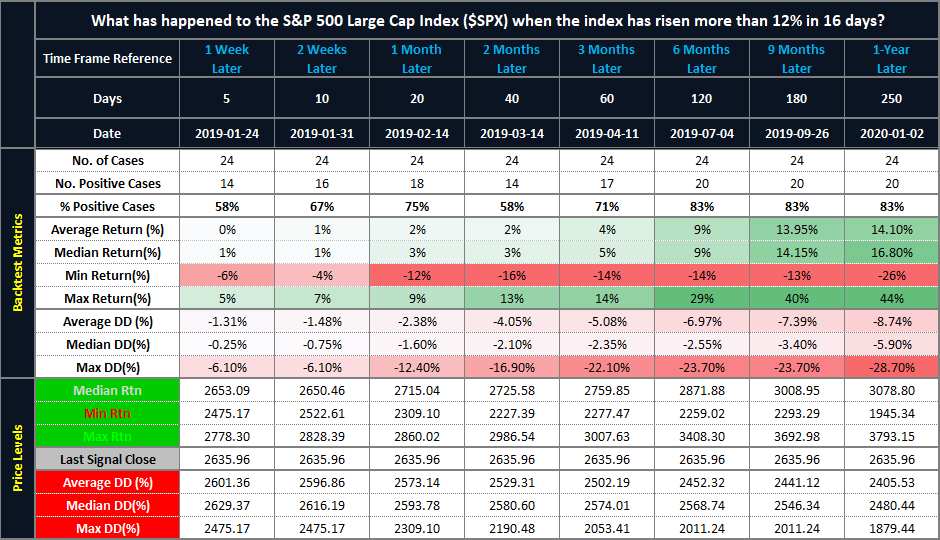
In looking at the backtest results from 3-months to 1-Year Following the original signal, the number of positive cases in this time range from 71% to 83% implying that more often than not, following the original signal, the market has also had a tendency to rise over this time frame. The Average to Median Gains have been observed at +4 to +17%. As we recognize that the market does not rise in straight lines, we should expect average drawdowns of -8.74% and median drawdowns of -5.90%.
CONNECTING THE DOTS
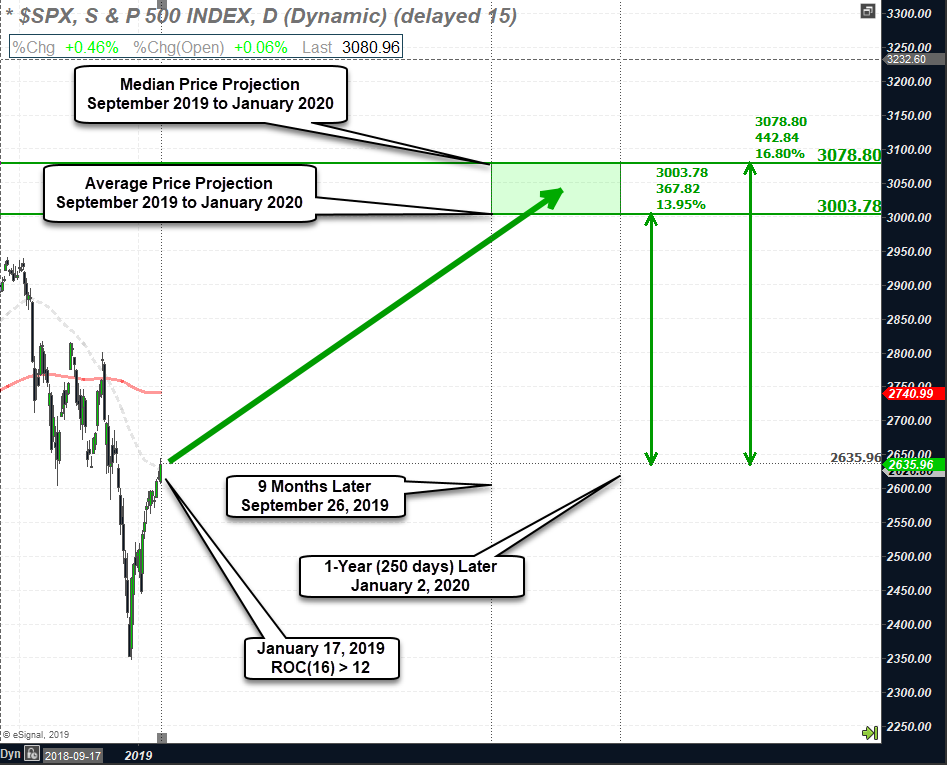
This is where the rubber hits the pavement and we can start using this data. For example, based on a closing price of the S&P 500 on January 17, 2019 of 2635.96, the median price projection for the S&P 500 to January 2, 2020 is 3078.80. The average price projection is 3003.78 (not shown). Figure 6 illustrates this projection directly on a chart of the S&P 500.
Figure 6: S&P 500 – ROC(16) > 12 – Price Projection
From 1970 to 2018, the S&P 500 has averaged an annual return of +8.48% with average drawdowns of up to -8.74%. The backtested results on the ROC(16) > 12% signal indicate that +14 to +17% returns are possible up to one year later. With comparable drawdown metrics on the ROC(16) > 12% signal vs historical average drawdowns, this rare signal indicated that returns could be 1.65 (14 / 8.48) times higher than average. In short, this is a signal worth paying attention to.
Figure 7 illustrates the performance of the S&P 500 following the original signal on January 17, 2019 as of the close on November 4, 2019.
Figure 7: S&P 500 – ROC(16) > 12 – Actual Results
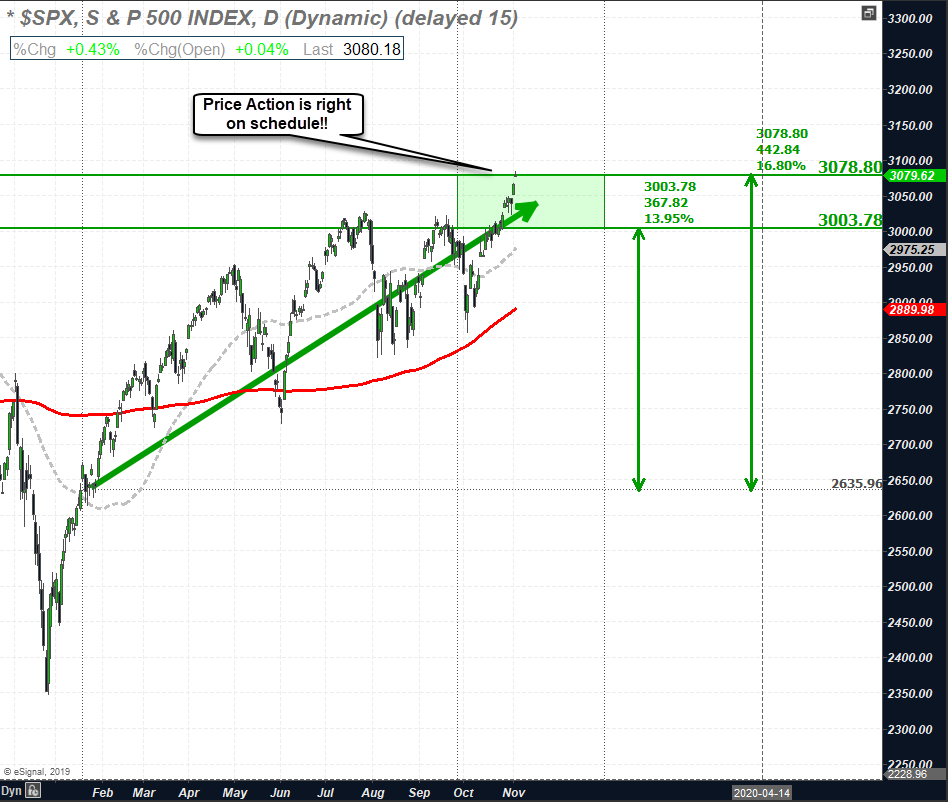
As shown above, the S&P 500 has arrived at it’s price target between 3078.80 and 3003.78. The ROC(16) > 12% is a rare price thrust on the S&P 500 and only a single signal to which we are drawing conclusions from. Generally speaking, most investors, myself included would be looking for additional confirmation of direction. As mentioned previously, the above analysis can be repeated on any ticker symbol on any time-frame.
CONCLUSIONS
While there is no way of knowing what will happen in the future, by analyzing past price behavior we can explore a factual range of future possibilities. The Quantitative Analysis presented in this eBook is only but one of a few ways that we analyze the markets each and every week. Each week, we use a Weight of the Evidence Approach thereby complementing various Quantitative Analysis with Intermarket Technical Analysis, Market Breadth and Trend Following. By assessing the Weight of the Evidence, we can develop an un-biased thesis on the markets and transact accordingly based on the current facts in hand. Further, each week we can ask whether current price action aligns with this thesis. When the answer is yes, we can continue along our current path. When the answer is no, we must question the validity of the thesis and make alternate arrangements to our plan. While the above approach is specific to the technical side of the market, similar concepts can be applied to market fundamentals as well.
This….is how you Truly Stack the Odds in Your Favor.
REFERENCES
- Roberts, Lance. “Americans Are Still Terrible at Investing, Annual Study Once Again Shows.” MarketWatch, Oct. 2017, www.marketwatch.com/story/americans-are-still-terrible-at-investing-annual-study-once-again-shows-2017-10-19. Accessed 4 Nov. 2019.
- 2018 Dalbar’s Quantitative Analysis of Investor Behavior Report. Dalbar, 31 Dec. 2017.
- “Break the Cycle of Emotional Investing.” Aig.Com, 2019, https://www-1012.aig.com/research-planning/investor-education/investing-emotions/break-the-cycle-of-emotional-investing.aspx. Accessed 4 Nov. 2019.