2020-06-23 – Nasdaq 100 ETF (QQQ) Trend, Seasonal Tendencies, Strength vs Weakness and Divergences
Over the past few weeks, we have been asked by several of our followers a similar question.
Can the market continue to move higher? Are there any warning signs? What can we expect?
In this short post, we will attempt to answer some of these questions.
As the Nasdaq 100 Large Cap Index ETF (QQQ) has been one of the leading index’s since the March 23, 2020 low, lets focus our attention there first. This post will focus on the US Nasdaq ETF (QQQ), however the same concepts can be applied for Canadian Investors using the ZQQ-TC or XQQ-TC or HXQ-TC ETF’s.
The screen shot below illustrates the QQQ ETF with a way to view trends on varying time frames using the Percent Price Oscillator (PPO).
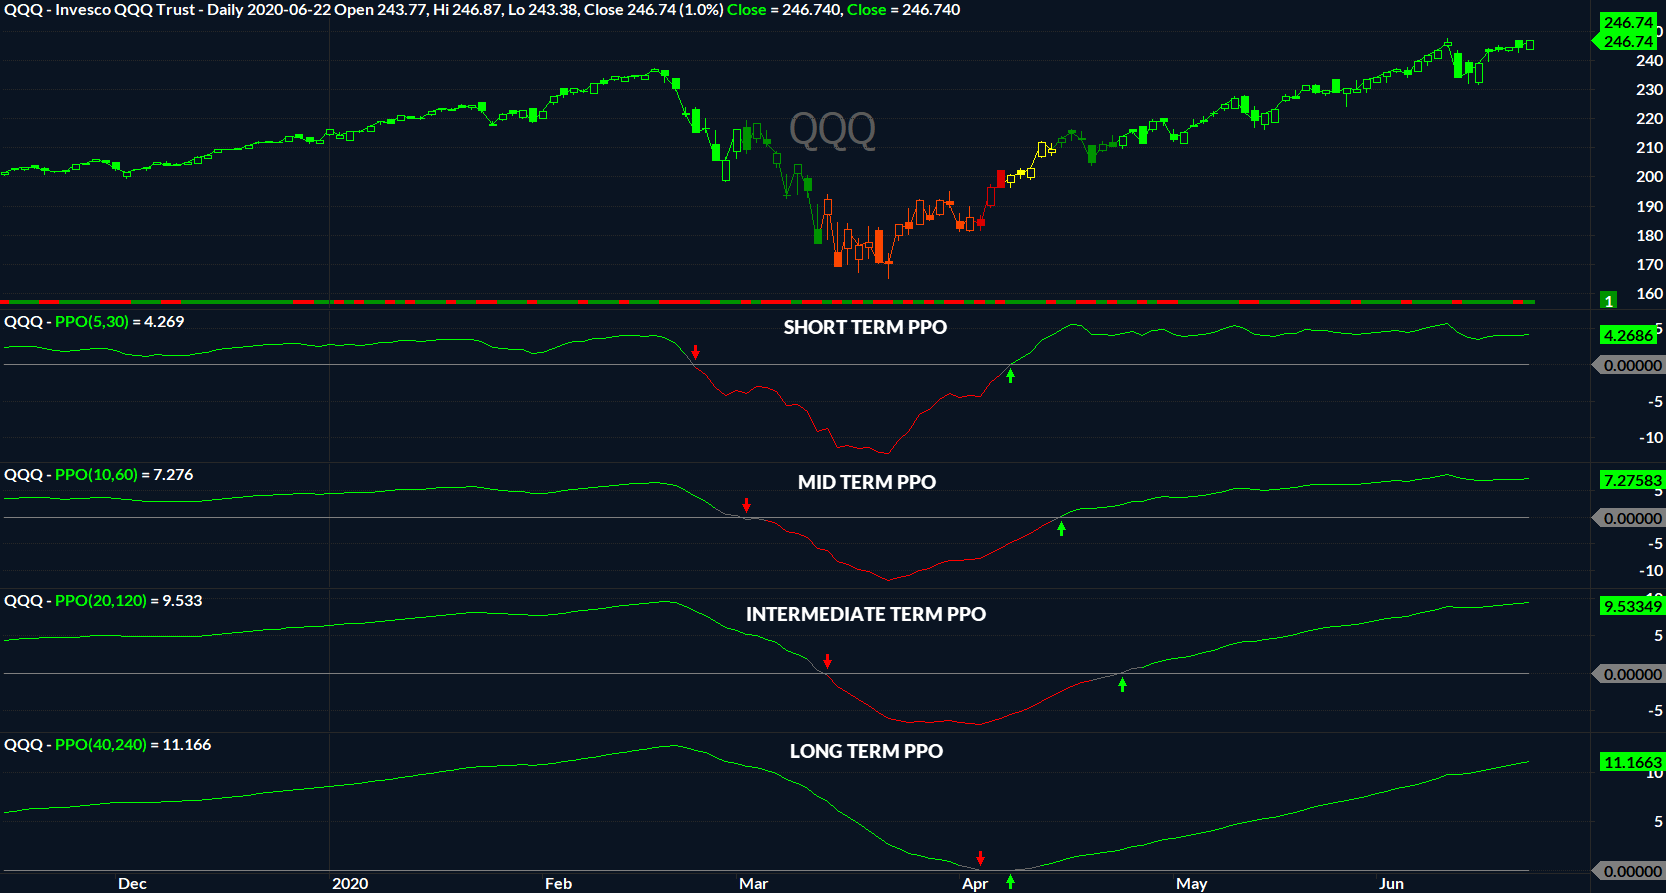
As shown above, all PPO’s on all time frames reside above zero (short term EMA is above the long term EMA) whereby indicating that the direction of the trend is still rising on all time frames. From a Trend following perspective, the current trend is up until its not. When will it end? The answer to that question, simply, is when the market is ready.
While we have no way of knowing how long the trend can continue, our Season Profit Explorer (SPE), shown below, indicates that, historically, over the past 20-years, that the QQQ ETF has performed well in the month of July.

As shown above, over the past 20-years, the QQQ ETF has produced a positive return 67% of the time with an average gain of 1.52%. This does provide insight that the trend may continue to rise higher into next month.
The next chart below provides some additional answers.
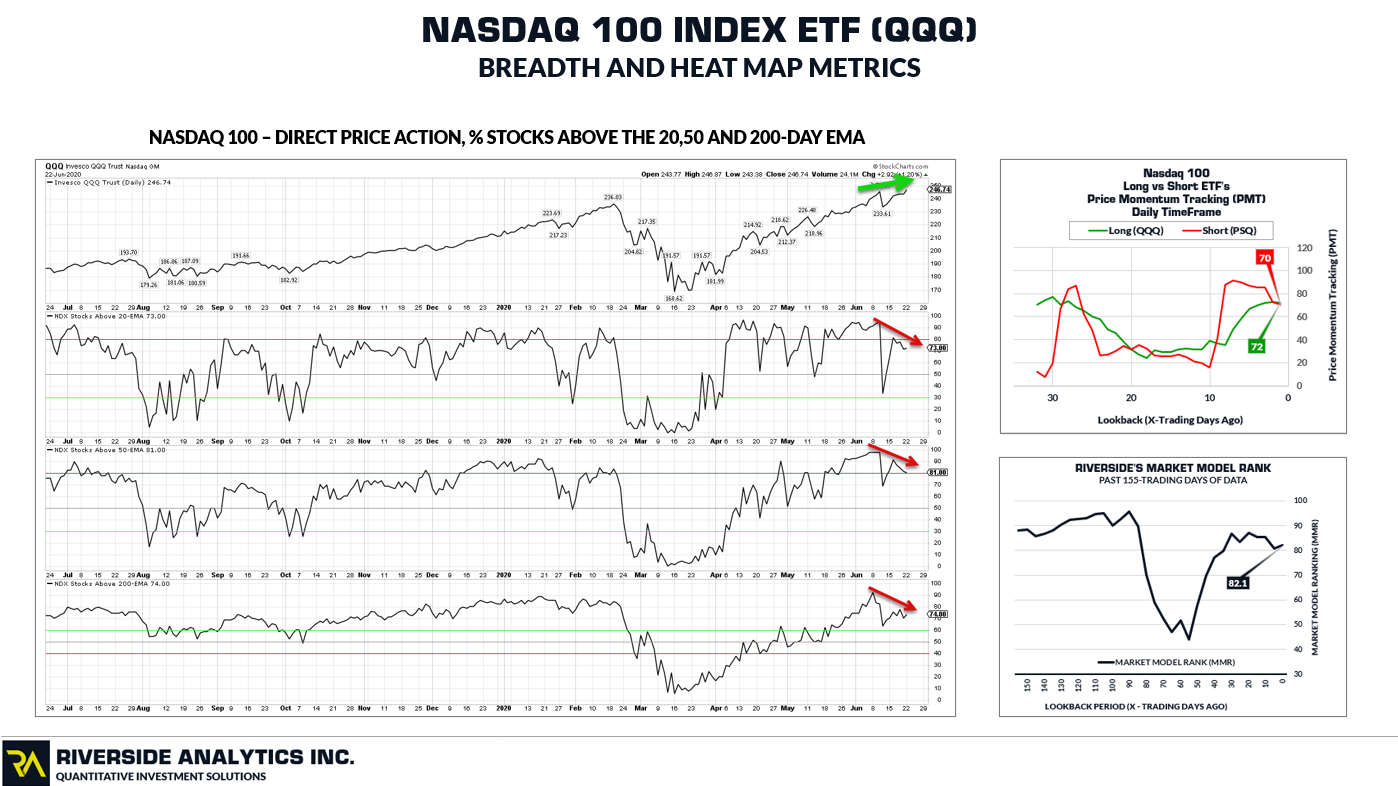
The bottom right image illustrates our Price Momentum Tracking (PMT) indicator on the Long and Inverse ETF’s on the Nasdaq. As of the close yesterday June 22, 2020, the Long ETF QQQ has produced a PMT reading of 72 whereby tepidly crossing over the Nasdaq Inverse ETF (PSQ) with a reading of 70. This does indicate that the Long ETF now has an advantage over it’s inverse counterpart . To further support a bullish case for the Nasdaq, our Heat Map Market Model Rankings (bottom right) shows the QQQ ETF with a reading of 82.1 or within the 82nd percentile of all US ETF’s. This further re-enforces the strength of the index.
BUT……
Investors and traders should be aware that the recent rise in the Nasdaq is not being supported by the broad index. The % Stocks Above the 20,50 and 200 day EMA indicators (left) have been declining as the Nasdaq has been rising. This forms what is a called a “Bearish Divergence”. These sort of divergences tend to lend themselves to sharp corrections in price action. Investors and traders can protect positions through the use of trailing stops as price continues to rise.
Regards,
Tim Koen, P.Eng
President
Riverside Analytics Inc
tim.koen@riversideanalyticsinc.com
www.riversideanalyticsinc.com
Riverside Analytics Inc (Riverside), its employees or its directors are not a registered financial advisers and do not provide investment advice or recommendations directed to any particular subscriber or in view of the particular circumstances of any particular person. Subscribers to Riverside or any other persons who buy, sell or hold securities should do so with caution and consult with a registered financial adviser before doing so. At various times, the publishers and employees of Riverside may own, buy or sell the securities discussed for purposes of investment or trading. Riverside and its publishers, owners, and agents are not liable for any losses or damages, monetary or otherwise, that result from the content of Riverside. Past results are not necessarily indicative of future performance. You are advised to discuss your specific requirements with an independent financial adviser.