2020-05-19 – Riverside’s Heat Map Analysis Window – Market Sentiment Update
- Each week, we assess Market Sentiment using our proprietary Heat Map Analysis Window;
- Specifically, we are assessing the average strength or weakness, of both Offensive and Defensive Assets using our Price Momentum Tracking (PMT) Indicator;
- Riverside’s PMT indicator, is an indicator, that to our knowledge, does not exist in any charting platform or is being used by financial institutions;
- As markets exist on multiple time-frames we analyse sentiment based on two time frames as noted below;
- A Short – Term (Daily) time frame is assessed using Daily Closing data;
- A Long – Term (Weekly) time frame is assessed using Weekly Closing data. The PMT values on this time-frame are provided in our Heat Map each week;
- Based on these sentiment readings, if the average strength of Offensive Assets is stronger than the average strength of Defensive Assets, the market is preferring higher risk assets and would be considered “Risk-On”. If the average strength of Defensive Assets is stronger than the average strength of Offensive Assets, the market is configured to be risk adverse and would be considered “Risk-Off”.
- These unique relationships provide a great insight into the Market’s asset preference over two distinct time-frames;
- The two time frames further enables us to quickly identify changing market conditions (i.e. the February 2020 market decline and also the March 2020 low);
- We have created Average PMT readings for Offensive and Defensive Assets, over short term and long term time-frames for our Global, US and Canadian Heat Maps.
- The image below illustrates Market Sentiment through our Heat Map Analysis Window as of the close on May 19, 2020;
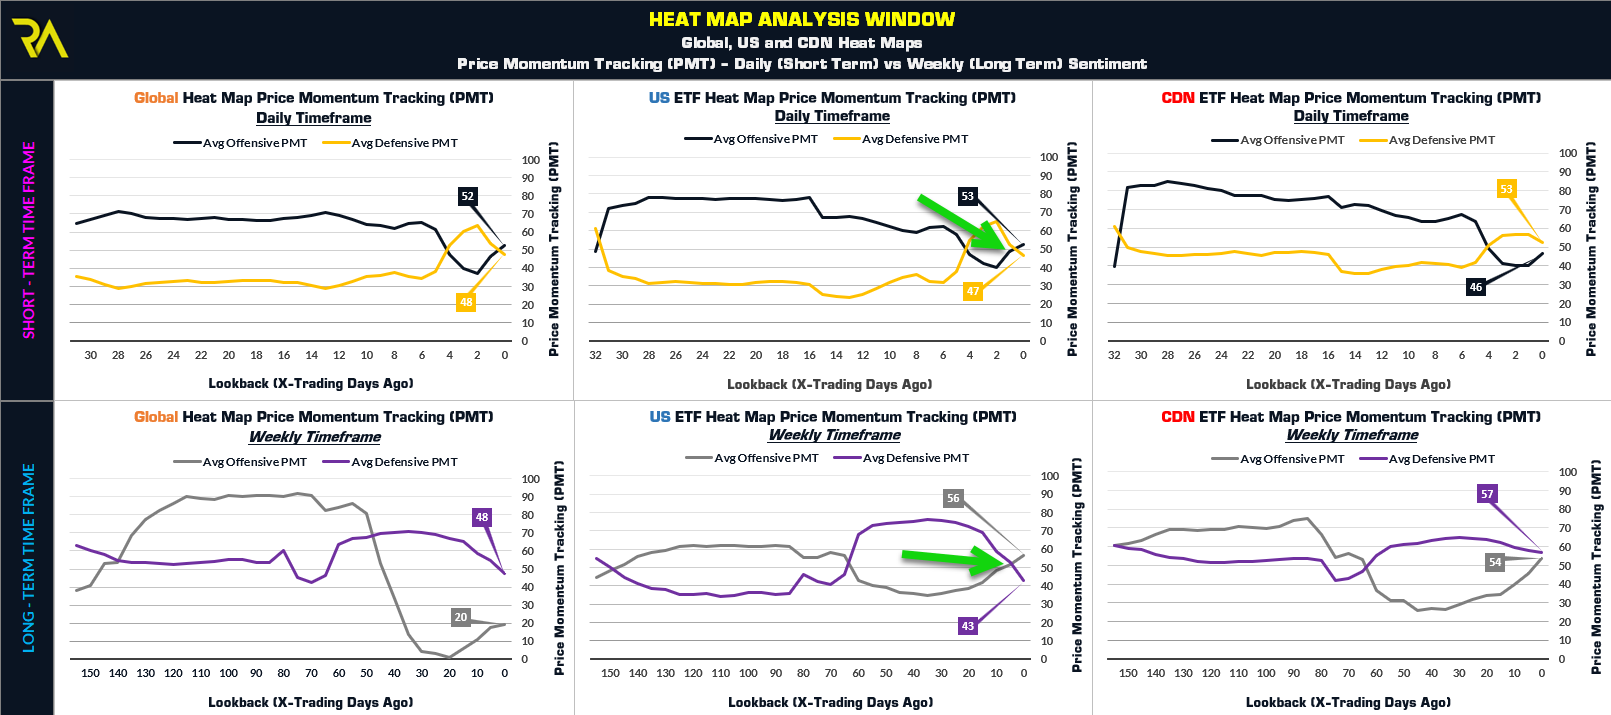
In reviewing the Short – Term PMT Readings (see the top pane of charts above), we alerted our followers of changing market sentiment on April 2, 2020 as the average PMT readings of Offensive Assets overturned the average PMT readings of Defensive Assets following the February 2020 market crash. This insight was key to assessing changing market conditions over the short term in the recent rally. This indicator did produce a head fake over the past week with Defensive Assets overtaking Offensive Assets, however as of the close on May 19, 2020, average PMT readings of Offensive Assets are again stronger than the average PMT readings of Defensive Assets. This speaks to the markets favoring higher risk assets over the Short – Term.
Over the Long – Term Time frame, the February 2020 crash has resulted in significant technical damage to a number of charts and technical indicators. This damage will take time to heal. We are currently seeing this healing process take form as the US Heat Map is once again showing that Offensive Assets have stronger Price Momentum than their Defensive counter parts. This continues to speak to improving market conditions and the market favoring higher risk assets.
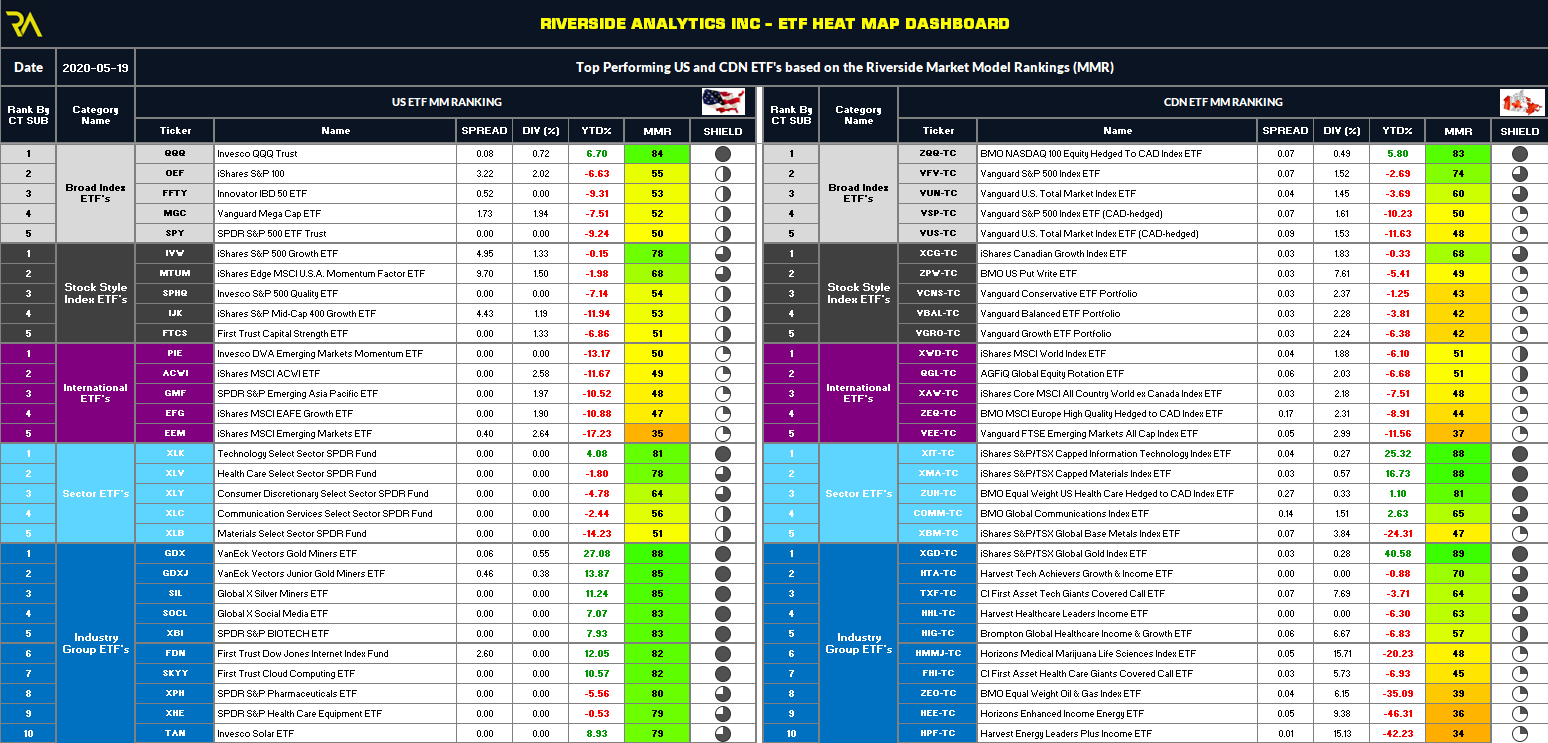
Members and followers of Riverside can use our weekly ETF and Stock best lists to quickly identify the strongest Offensive or Defensive Assets within our Heat Maps. The screen shot below illustrates the top 5 US and Canadian ETF’s (as measured by our Market Model Rankings), in each ETF group as of the close on May 19, 2020;