2020-06-03 – Is the US Dollar Losing it’s Strength? What to Watch for on the USD/CAD Currency Pair
The USD/CAD currency pair may be tracked through various ticker symbols on various platforms as outlined below;
- eSignal CAD A0-FX = stockcharts.com $USDCAD
- eSignal USDCAD A0-FX = stockcharts.com $CADUSD
- The DLR-TC ETF tracks the eSignal CAD A0-FX ticker
For the CAD A0-FX ticker symbol, should this ticker symbol rise, this would indicate that the US Dollar is out performing the Canadian Dollar. Should the ticker symbol fall, this would indicate that the Canadian Dollar is out performing the US Dollar.
This ticker symbol is particularly useful for Canadian Investors as many Canadian Investors maintain investments in US funds. Further, some ETF’s here in Canada provide the option to transact Hedged (tracks the Canadian Dollar) and Non-Hedged (tracks the US Dollar) ETF’s.
On May 24, 2020 we alerted our followers to a potential shift in the relationship of the USD/CAD currency pair as illustrated below. At that time, we noted the formation of a Descending Triangle Pattern.

Descending Triangle Patterns, in general, are Bearish chart patterns. While the CAD A0-FX was holding above 1.385 and inside the Descending Triangle Pattern, we were watching closely for further direction. We noted that should the CAD A0-FX break below the bottom of the triangle at 1.385, we would anticipate the the downside price target of 1.34 to be reached before the end of June 2020.
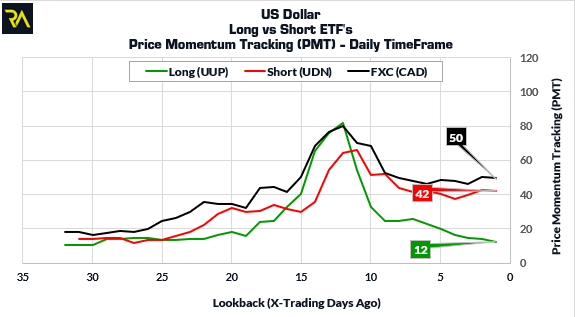
Also on May 24, 2020 we provided our followers with the following slide, illustrating our Price Momentum Tracking (PMT) and Swing Detection Tracking (SDT) Indicators on the Long and Inverse US Dollar ETF’s, UUP and UDN respectively.

At that time, our short term PMT indicators indicated that the long ETF (UUP) was weaker than it’s Inverse ETF (UDN). Further, the CAD Dollar ETF FXC was also stronger than UUP. This provided an additional insight that the US Dollar may be weakening in relation to the CAD. Key price levels for the US Dollar Long and Inverse ETF’s were identified by our SDT indicators were provided in preparation for a higher probability decline in the US dollar and as well as a Lower Probability Rise.
We provide levels on both ETF’s as market conditions can change quickly. This enables us to stay nimble in the markets.
The image below illustrates the CAD A0-FX as of 7:30am on June 3, 2020.
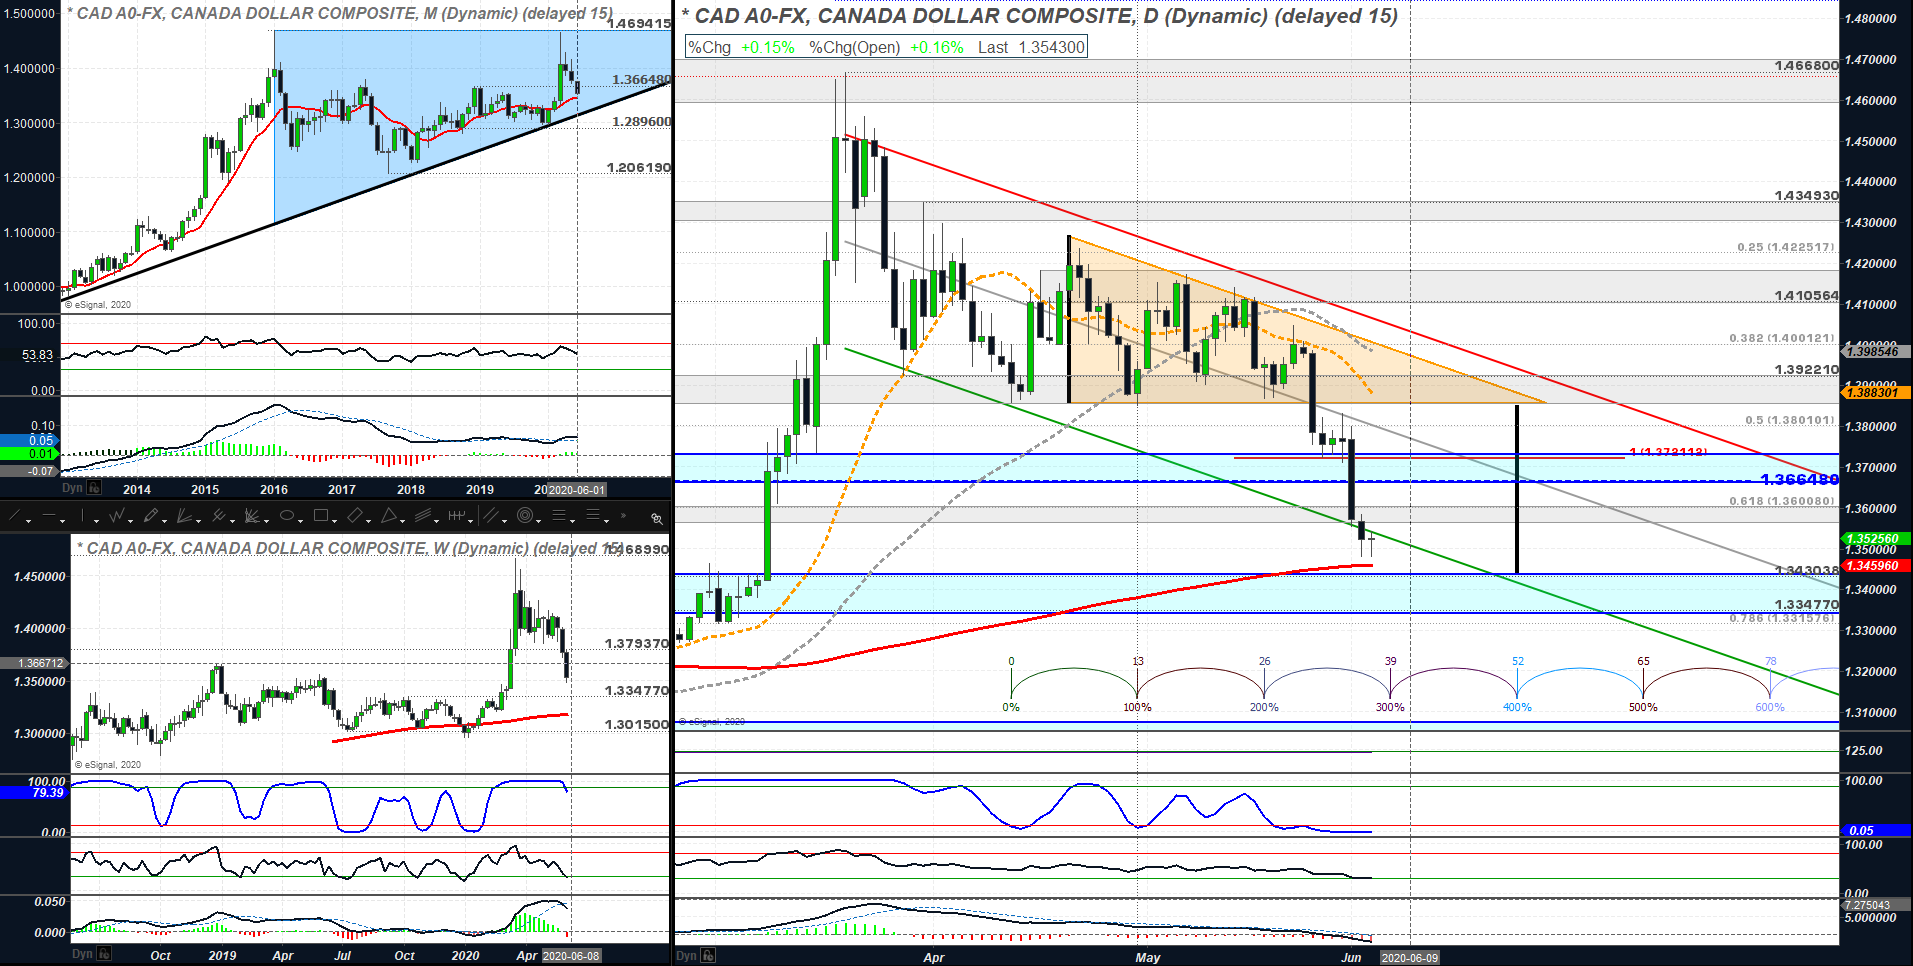
The CAD A0-FX has nearly reached it’s lower price target of 1.343 and now resides below the bottom of the 2-Standard Error Regression Channel (green). The move outside the bottom of the Regression channel implies an “Oversold Condition” and accordingly, the CAD A0-FX will be looking to revert to the mean or center of the Regression Channel over the next few weeks. This would imply a strengthening US Dollar in relation to the CAD with a price advancement back up to overhead resistance of 1.366 to 1.372. The short red horizontal red line at 1.372 represents a previous measured price move in this currency pair. Traders can use this level as an over head, short term price target. A similar set up would present on the Canadian ETF DLR-TC. A close above 1.372 would imply a change in behavior and opening up a possibility of further advancement to the top of the Regression Channel (red). Should the CAD A0-FX break above the top of it’s Regression Channel (approximately 1.39), this would shift the odds back in the favor of the US Dollar.
As the direction and slope of the Regression Channel is now fully tilted down, the Canadian Dollar has the upper hand over the US Dollar. This observation is further confirmed by the current read on our PMT indicators as of the close on June 2, 2020 as shown below;
With the momentum of the currency pair in favor of the CAD, Investors may see a performance benefit of using Hedged Canadian ETF’s vs the Non-Hedged ETF’s where available.
Riverside Analytics Inc (Riverside), its employees or its directors are not a registered financial advisers and do not provide investment advice or recommendations directed to any particular subscriber or in view of the particular circumstances of any particular person. Subscribers to Riverside or any other persons who buy, sell or hold securities should do so with caution and consult with a registered financial adviser before doing so. At various times, the publishers and employees of Riverside may own, buy or sell the securities discussed for purposes of investment or trading. Riverside and its publishers, owners, and agents are not liable for any losses or damages, monetary or otherwise, that result from the content of Riverside. Past results are not necessarily indicative of future performance. You are advised to discuss your specific requirements with an independent financial adviser.