2020-06-10 – Decision Time for Long Term Treasuries
Over the past month and a half there has been increased volatility in the long end of the bond curve. The 20+ Year Treasury ETF (TLT) has formed and executed its a bearish descending triangle, shown in purple below.
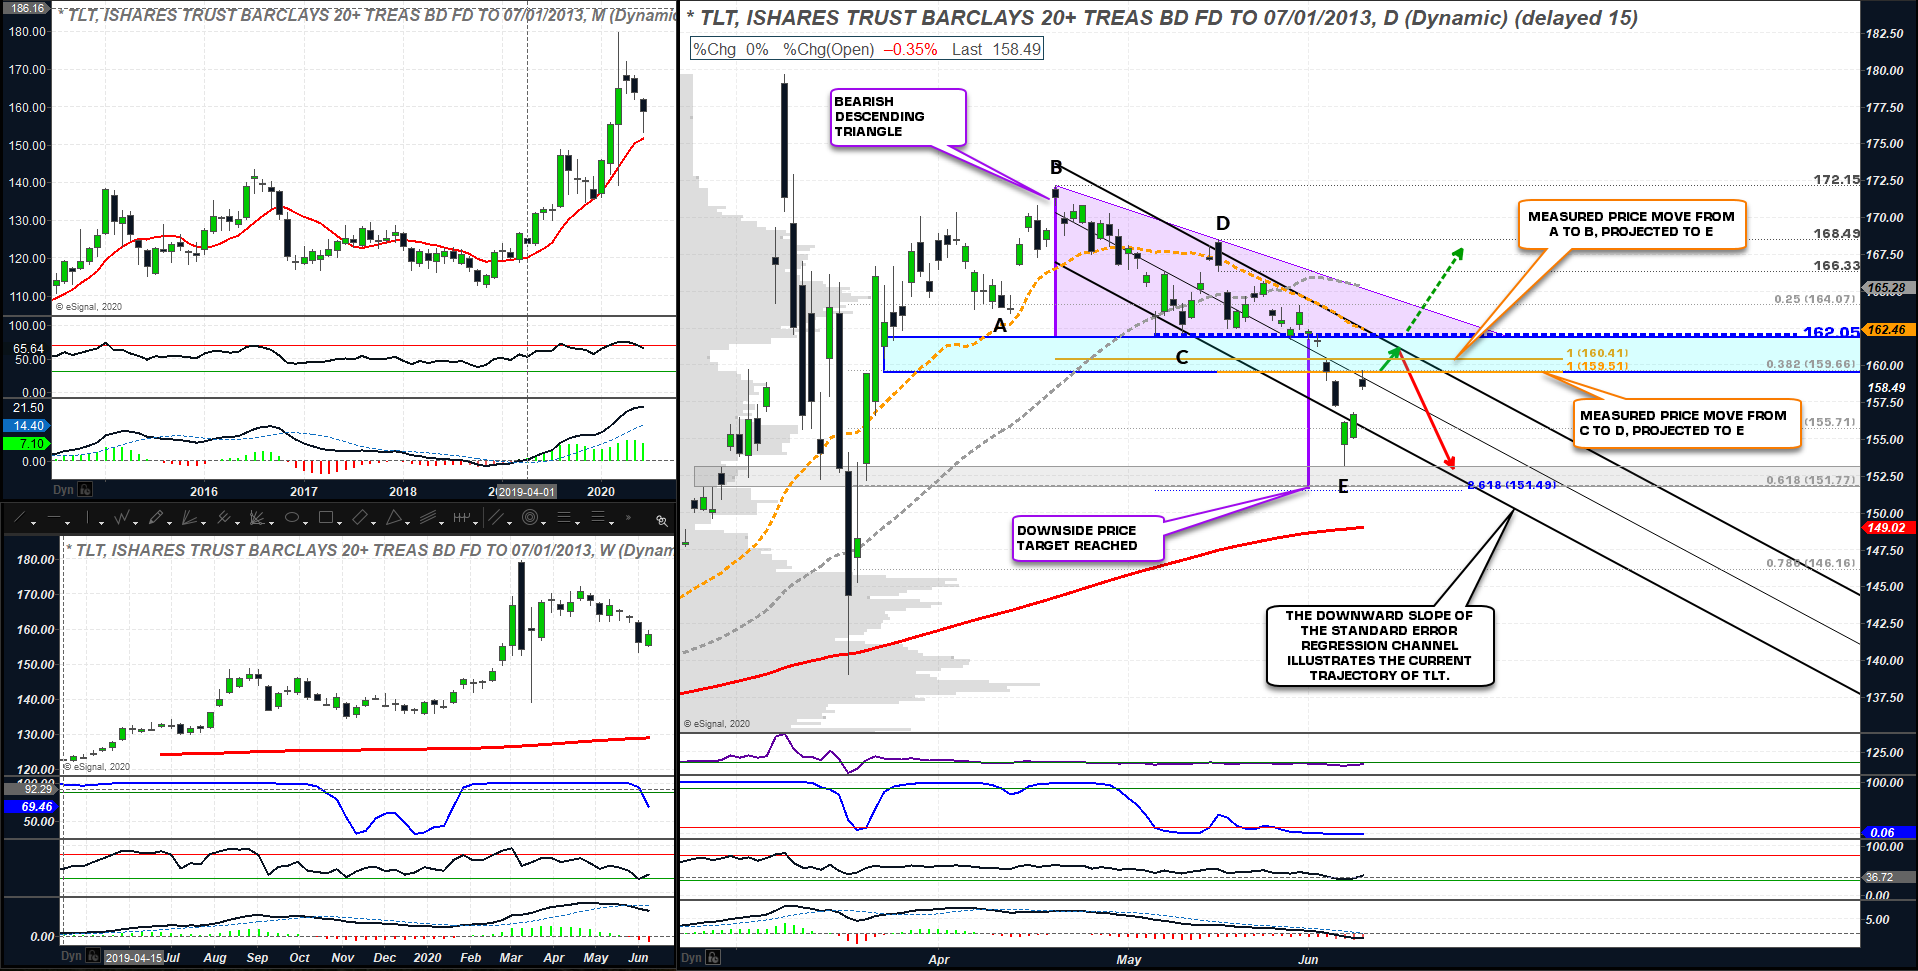
The downside price target of this chart pattern at 151.49 was nearly reached on June 5, 2020 when TLT put in a low at 153.16. Since putting in it’s June 5th low, TLT has rallied back just north of 4% in less than three days and closed at 158.49 on June 9, 2020. This recent volatility may be attributed to bond traders speculating on the future of Interest Rates and potential Yield Curve Control from the FED. Today’s FOMC statement and corresponding press conference will likely fuel further speculation in the Bond market.
There are two price projection lines detailed on the chart at 160.41 and 159.51. Both of these levels are measured from prior lows to highs and projected to the June 5th low at point E. Next, overhead resistance is formed at the May 6th low at 162.05. While we can’t predict the future, TLT is approaching an area of decision on the charts between 159.51 to 162.05, shown by the blue chart shading. This is a 1.53% area to which investors may use for further decision making. This area also corresponds to the upper channel boundary of the downward sloping 2 Standard Error Regression Channel shown in black.
The Bearish Case
With the Regression Channel sloping downward, this provides an expectation of the direction of the current trend and accordingly, Bond traders will be looking for a swing high in the decision area to initiate or add to short positions in the anticipation of lower prices in TLT.
The Bullish Case
Should TLT not produce a swing high in the decision area but rather close above 162.05, this increases the probabilities that TLT will at minimum want to challenge its April 2020 highs at 172.15.
Key Takeaway
There are many factors of the markets that we investors can not control. The only things we can control in the markets are the decisions we make and how much risk we carry in our portfolios. Regardless of the outcome of today’s FOMC meeting, the Bearish and Bullish Cases presented above provide a concise way to plan for both price directions in TLT. This simple planning exercise of looking at both bullish and bearish outcomes can be applied to any ticker symbol on any time frame to help reduce the emotional strain of the markets. Further, this simple planning exercise enables investors to look at both scenario’s without bias and be ready for the next move, regardless of direction.
Regards,
Tim Koen, P.Eng
President
Riverside Analytics Inc
tim.koen@riversideanalyticsinc.com
www.riversideanalyticsinc.com
Riverside Analytics Inc (Riverside), its employees or its directors are not a registered financial advisers and do not provide investment advice or recommendations directed to any particular subscriber or in view of the particular circumstances of any particular person. Subscribers to Riverside or any other persons who buy, sell or hold securities should do so with caution and consult with a registered financial adviser before doing so. At various times, the publishers and employees of Riverside may own, buy or sell the securities discussed for purposes of investment or trading. Riverside and its publishers, owners, and agents are not liable for any losses or damages, monetary or otherwise, that result from the content of Riverside. Past results are not necessarily indicative of future performance. You are advised to discuss your specific requirements with an independent financial adviser.