2020-02-25 Gold and Gold Miners Update
Throughout 2019, Gold was held (directly or indirectly) in many of the strategies we track at Riverside for a better portion of the year because of it’s strength in relation to other assets. Since breaking above a key price level of $12.48, identified on May 30, 2019, the IAU – iShares Comex Gold Trust ETF has risen in excess of 29% to it’s February 2020 high. Based on this impressive rally, should we expect prices continue to rise or has Gold reached it’s top?
In this post, I’ve provided a number of Detailed Charts with key levels to watch, Gold Miner Market Breadth, revisited a previous Backtest and provided an overall summary to wrap things up. I’m still liking Gold and Miners but do think we are in for a bit of a pause in the short term. Longer term, this area is still looking attractive at this point. Regardless of what I think, price levels are king.
” I will invest in the market we are given, not the one I think it is, or it should be”
Tim Koen, P.Eng
President
Riverside Analytics Inc
IAU – TECHNICAL ANALYSIS – NOVEMBER 29, 2019
- Shield Screen: Pass
- Shield Position Size: Full Positions
- Strategy CDN ETF = CGL-TC
- Inverse US ETF = N/A
- Dividend yield: N/A
- Momentum Add North of; $14.11, $14.30,$14.54
- Value Add at a bounce of support at; $13.82, $13.40, $13.24
- Stops – Chand Exits or ATR offsets
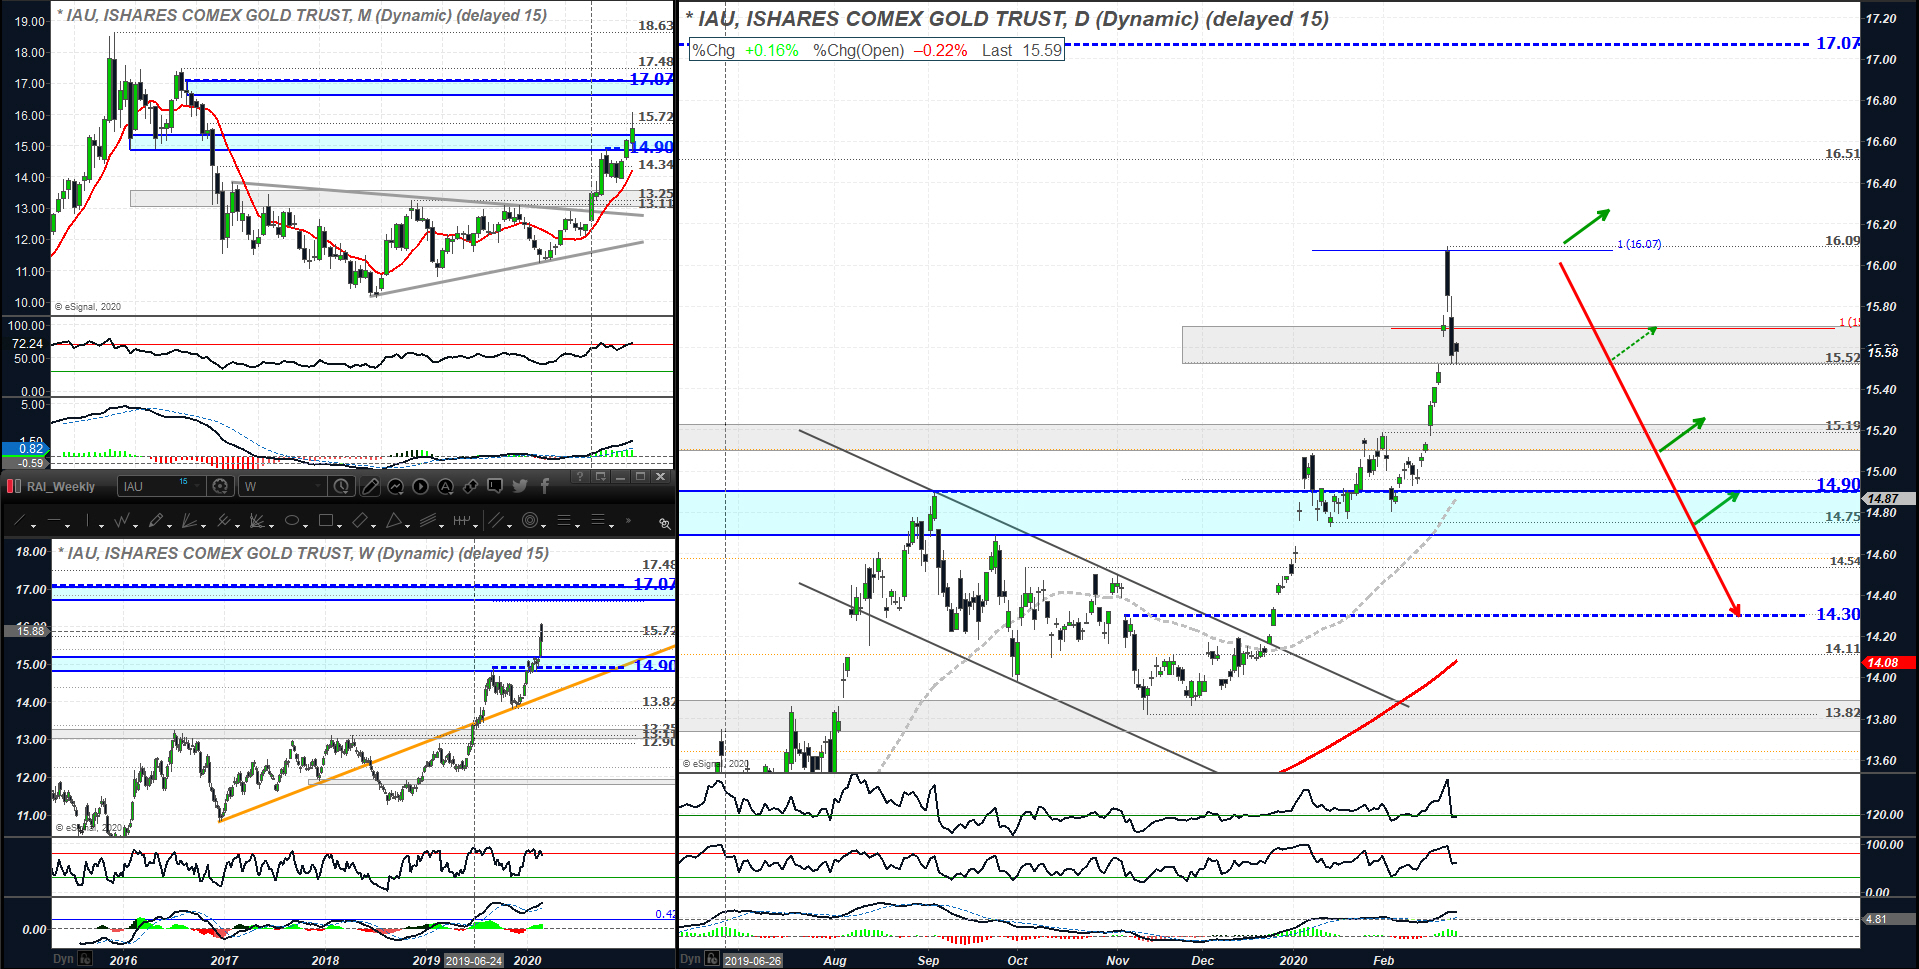
IAU – TECHNICAL ANALYSIS – FEBRUARY 25, 2020

- Shield Screen: Pass
- Shield Position Size: Full Positions
- Strategy CDN ETF = CGL-TC
- Inverse US ETF = N/A
- Dividend yield: N/A
- Momentum Add North of; $16.09, $16.50, $ 17.07
- Value Add at a bounce of support at; $15.52, $15.19, $14.75
- Stops – Chand Exits or ATR offsets
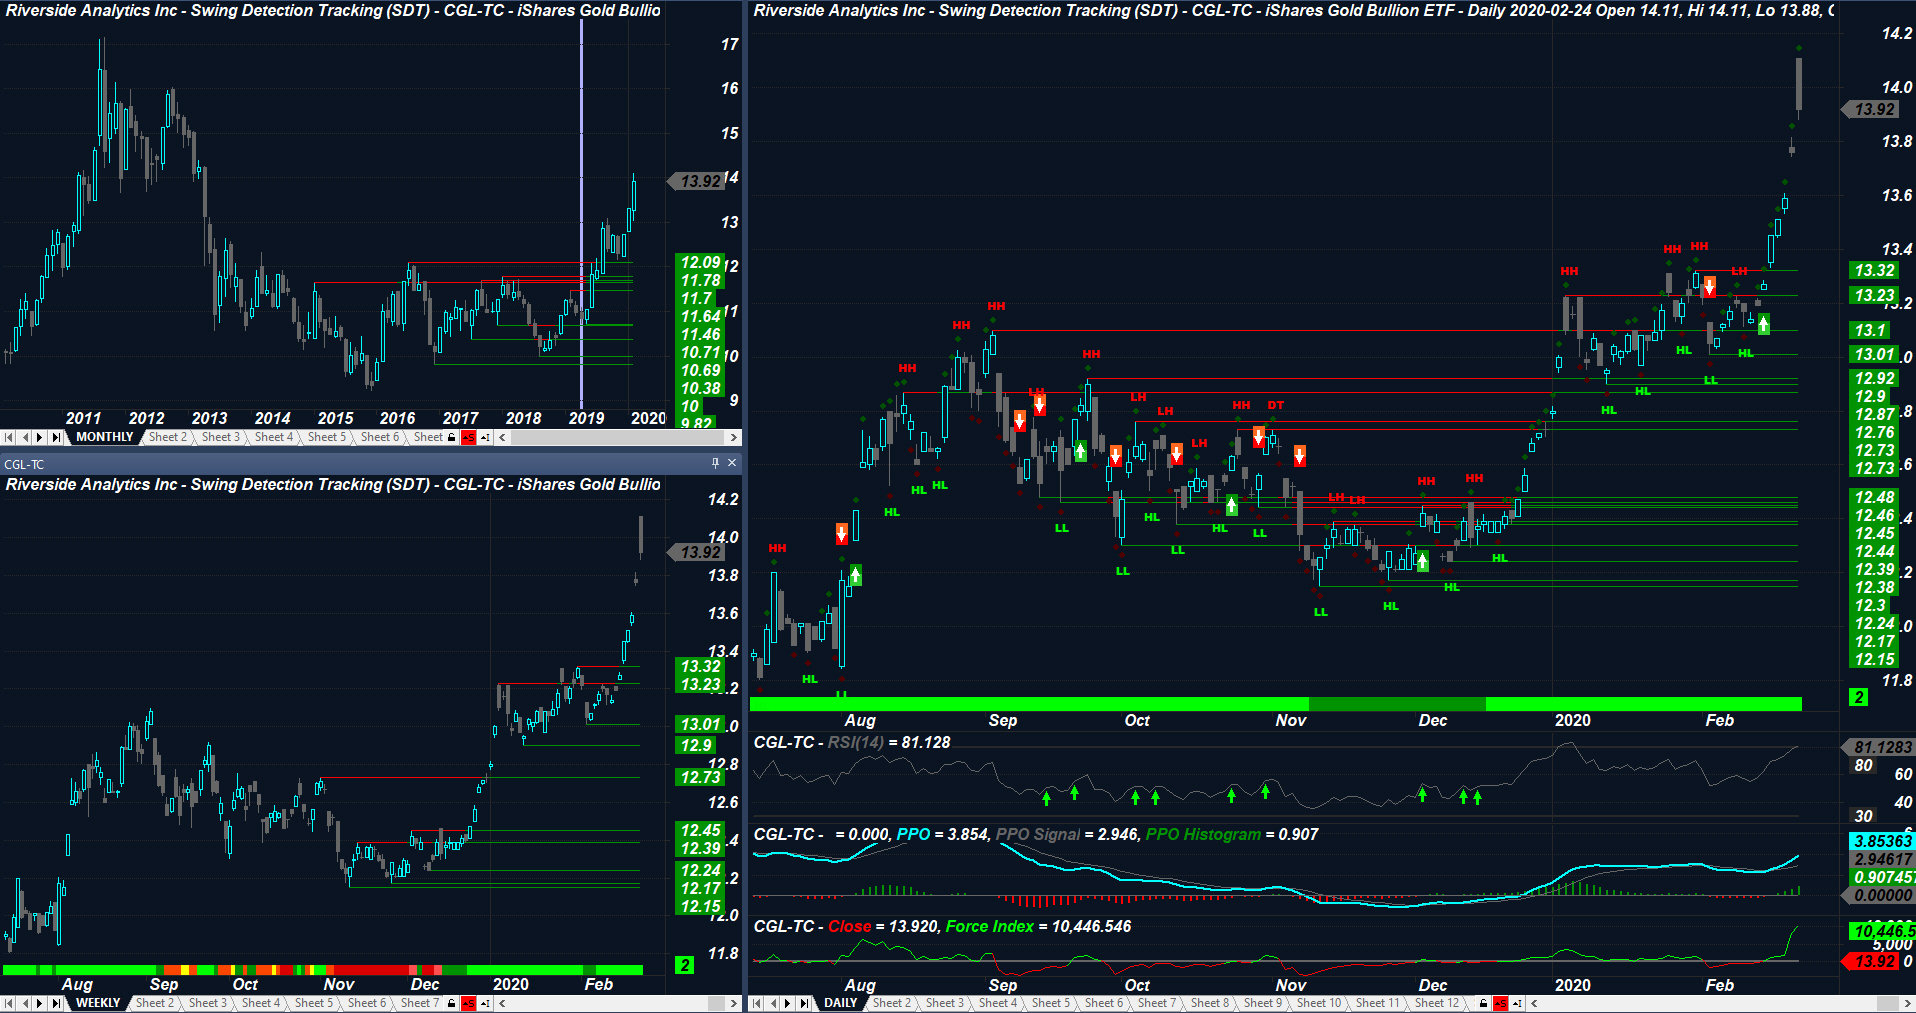
CGL-TC – TECHNICAL ANALYSIS – FEBRUARY 24, 2020
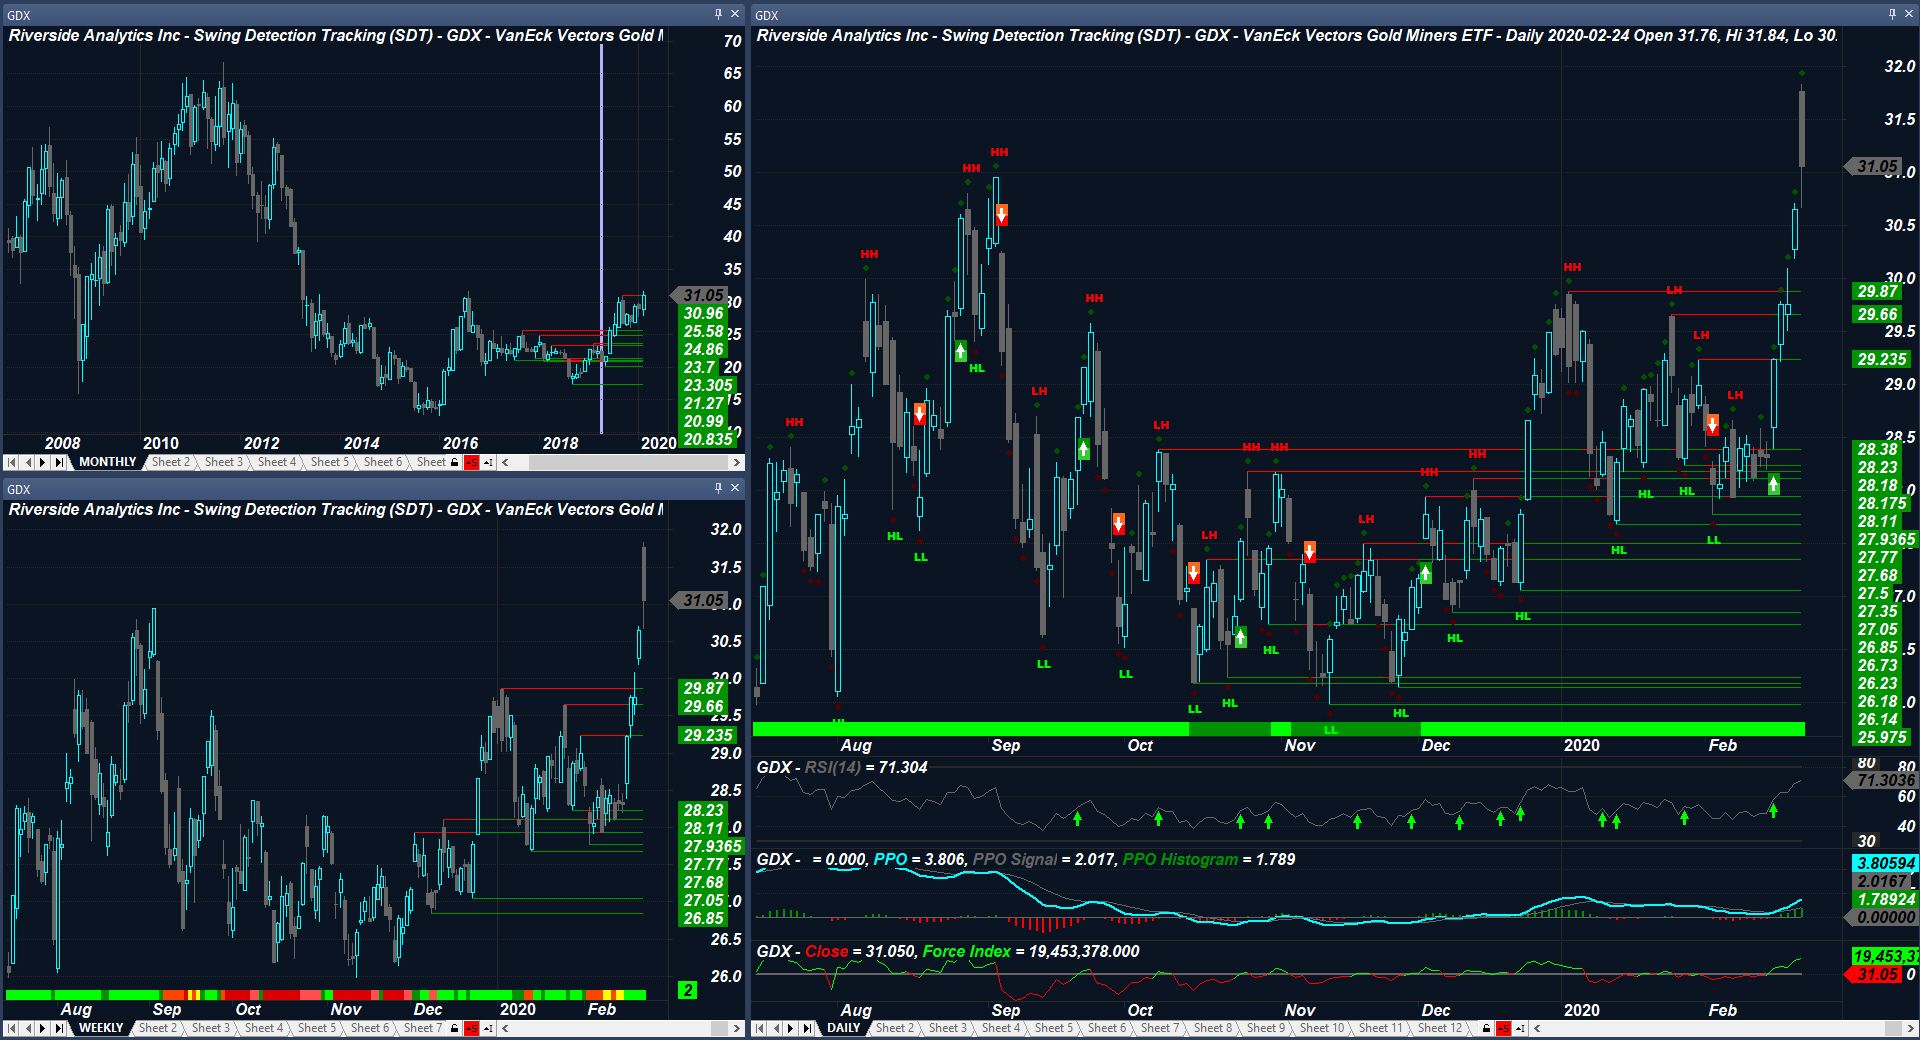
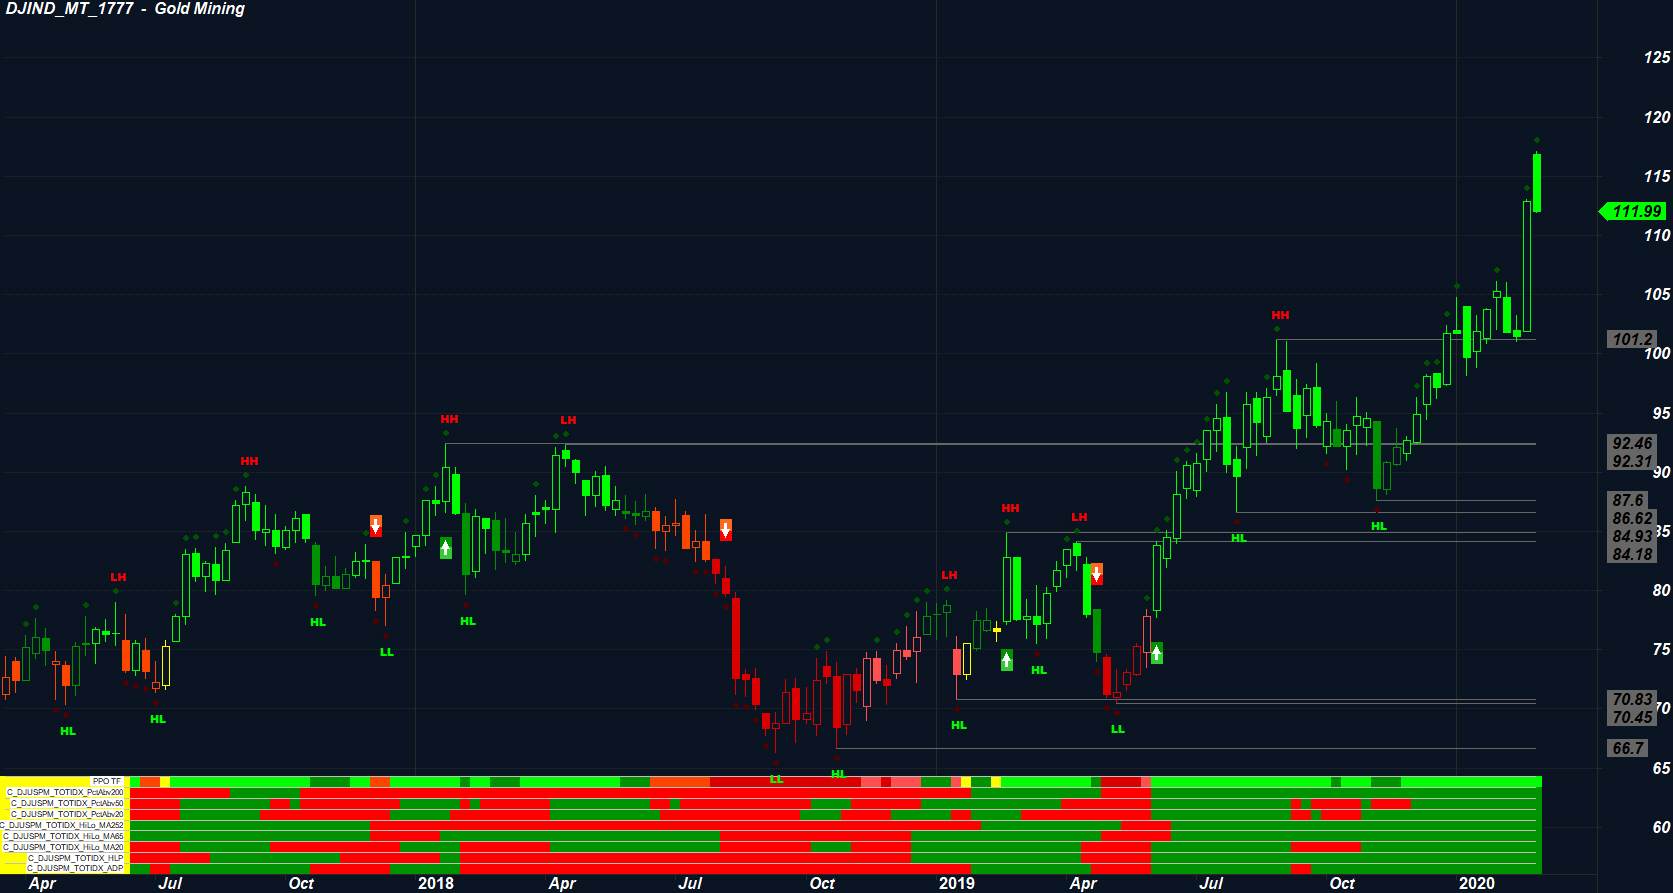
GDX – TECHNICAL ANALYSIS – FEBRUARY 24, 2020
US GOLD MINER MARKET BREADTH – FEBRUARY 24, 2020
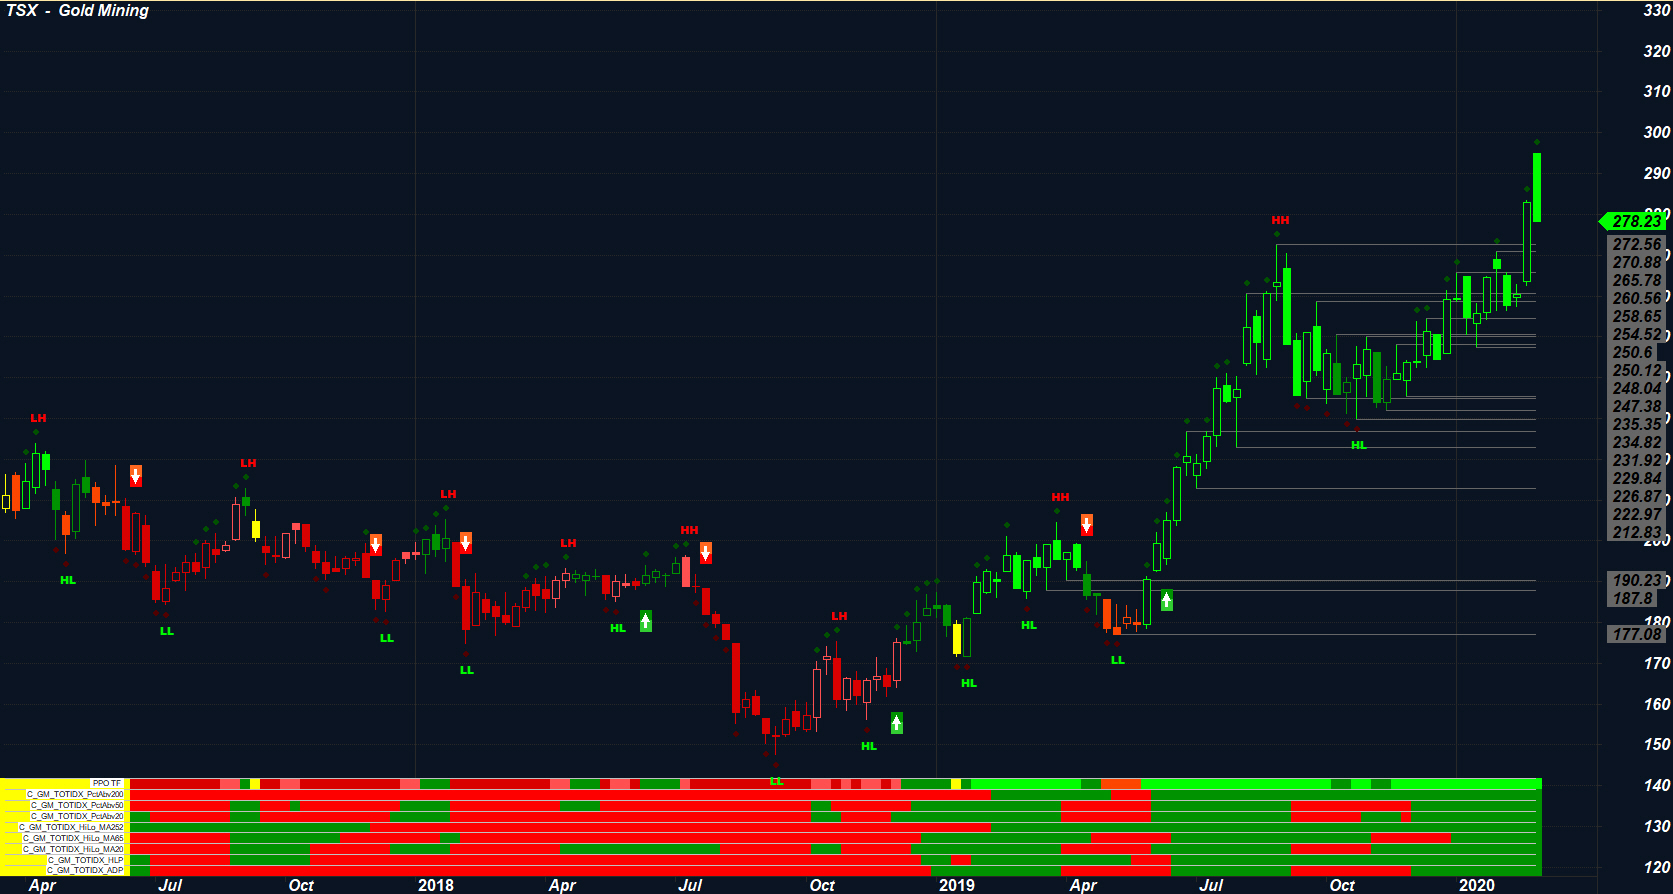
XGD-TC – TECHNICAL ANALYSIS – FEBRUARY 24, 2020

TSX GOLD MINER MARKET BREADTH – FEBRUARY 24, 2020
HISTORICAL PRICE ANALYSIS – $GOLD
The following is a backtest on the direct price of Gold ($GOLD) on July 19, 2019. I’m revisiting this analysis in this post as past price behavior can often provide unique insights into what we can expect as normal behavior following a particular signal. This is a weekly analysis completed from 1970 to 2019. I have used the results of this analysis to project Maximum, Minimum and Median price levels into 2020.
SET UP
On July 19 2019, the weekly PPO(1,40) on $GOLD exceeded 8% for the first time in more than 2-years as shown below;
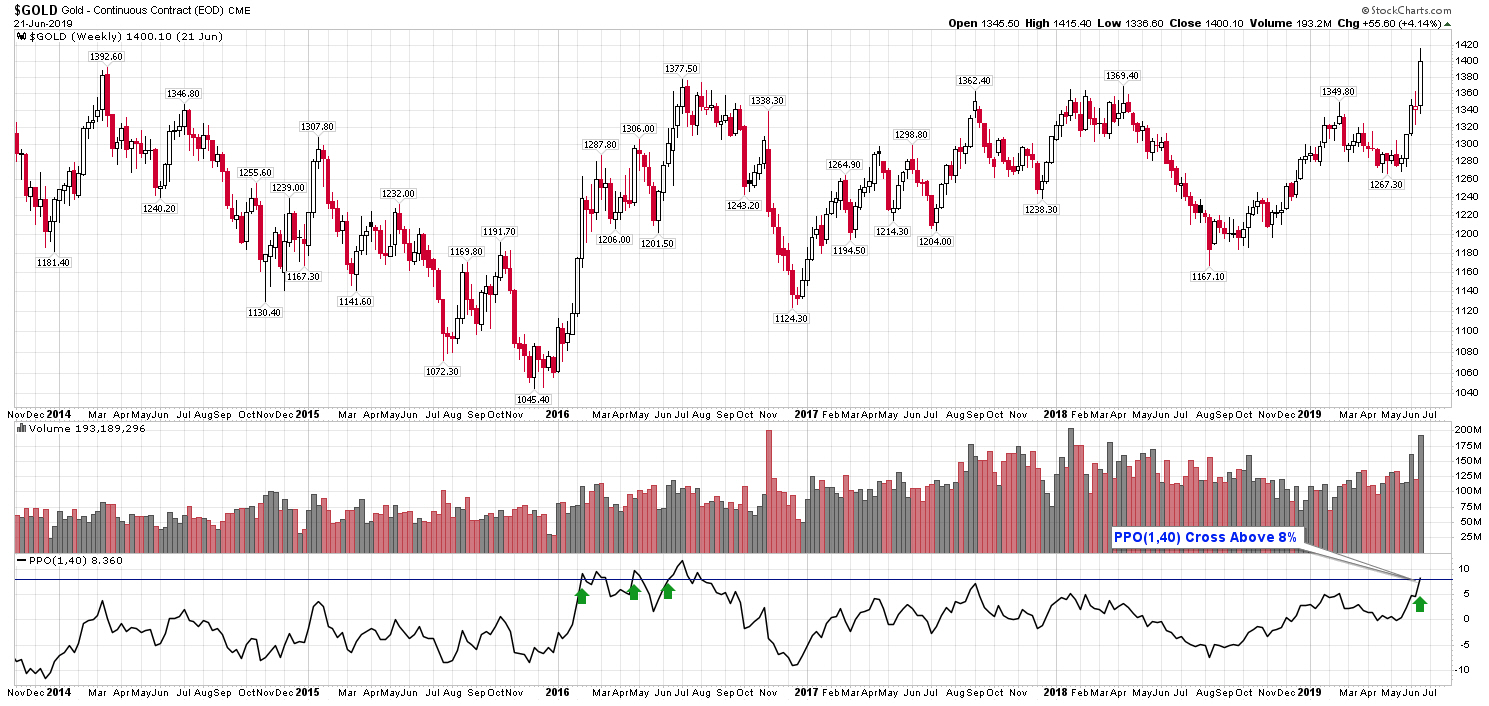
What has happened in the past when the weekly PPO(1,40) on $GOLD exceeded 8%?? The backtest results are provided below;
BACKTEST AND OVERALL SUMMARY
The remainder of this post includes the formal BackTest Results, Price Projections for 2020, Historical Signals and a Drawdown Analysis for reference.
In summary, as of the close on February 25, 2019 Gold resides between the Median and Maximum Price Projection levels for 2020 whereby confirming the strength of the commodity. Currently, Gold resides between the 20 and 40 Week Timeframe columns in the backtest summary table. Based on past price behavior, at a minimum we can expect gold to retain its value within the normal Drawdown ranges for the better part of 2020 and 2021. The longer term outlook on the commodity based on the previous technical analysis and historical price behavior continues to remain favorable from a longer term perspective.
As IAU has crossed above its 0.786 retracement at $15.72 on the monthly chart, challenging or exceeding it’s 2011 high appears to be a high probability.
However, trends do not move up in straight lines.
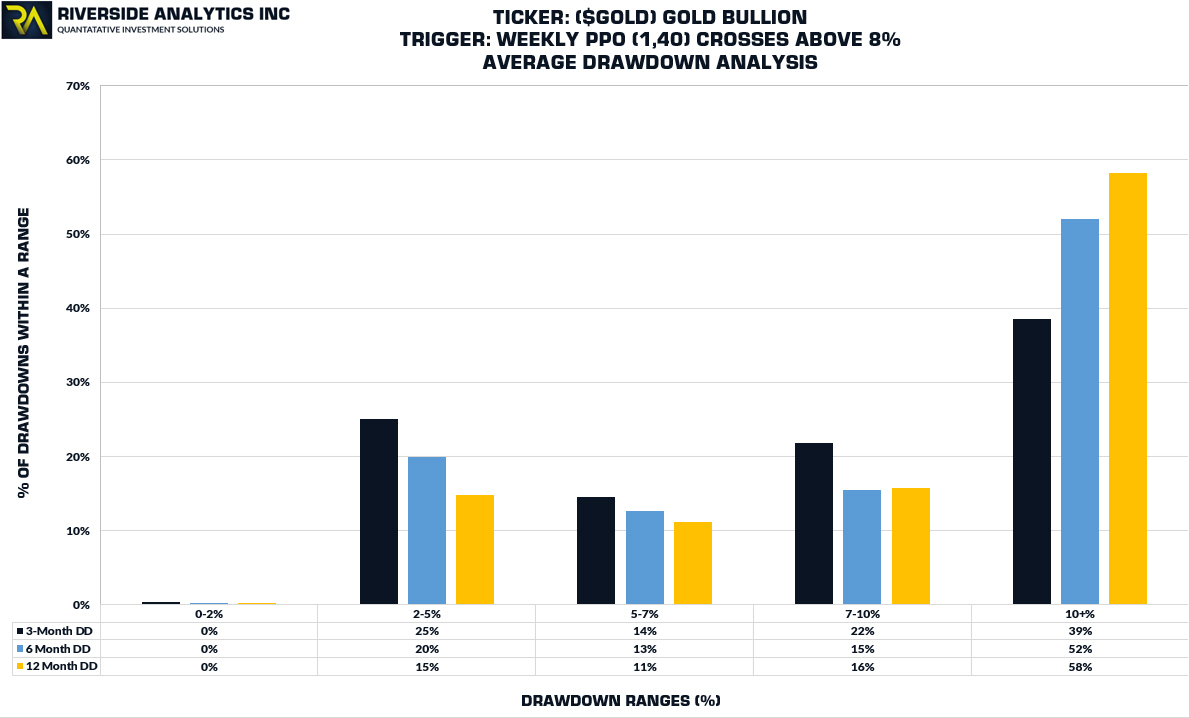
Accordingly, based on past price behavior, the ride can be quite bumpy with 74% of all drawdowns exceeding 7% up to 1-year following the original signal. Since July 2019, IAU has only undergone a -6.85% drawdown to date. This implies that a Normal and to be expected drawdowns of greater than 7% may be on the horizon.
Provided the overall trend and relative strength of the commodity remains strong, Gold continues to remain an favorable asset to portfolios.
BACKTEST RESULTS
The following table illustrates the backtest results of the analysis;
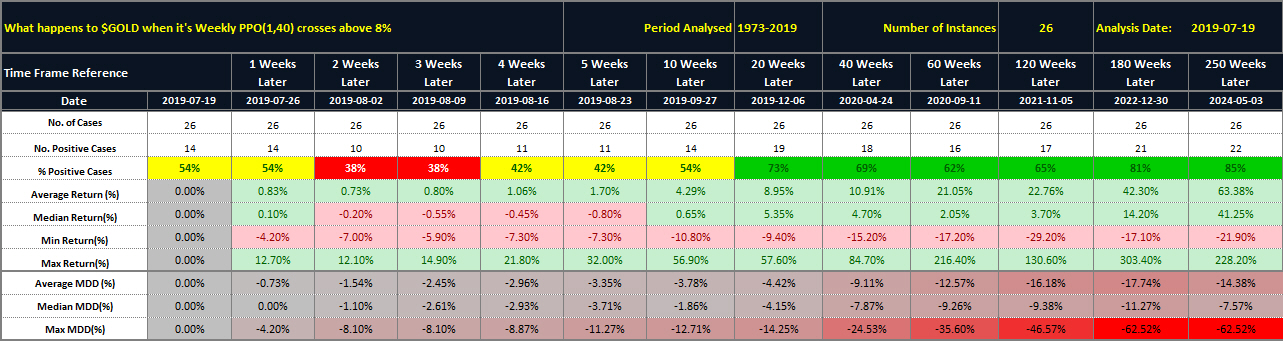
Short Term View – 1 to 4 Weeks
Based on a Shorter Term time frame of 1 to 20 days, following the original signal, the % of positive cases range from 38% to 42% with median gains of -0.80% to 0%.
Mid Term View – 5 Weeks to 20 Weeks
Based on a Medium Term time frame of 1 month to 6 months, following the original signal, the % of positive cases range from 42% to 73% with median gains of -0.80 to 5.35%.
Long Term View – 20 Weeks+
Based on a Medium Term time frame of 1 month to 6 months, following the original signal, the % of positive cases range from 69 to 85% with median gains of 5.35 to 41.25%.
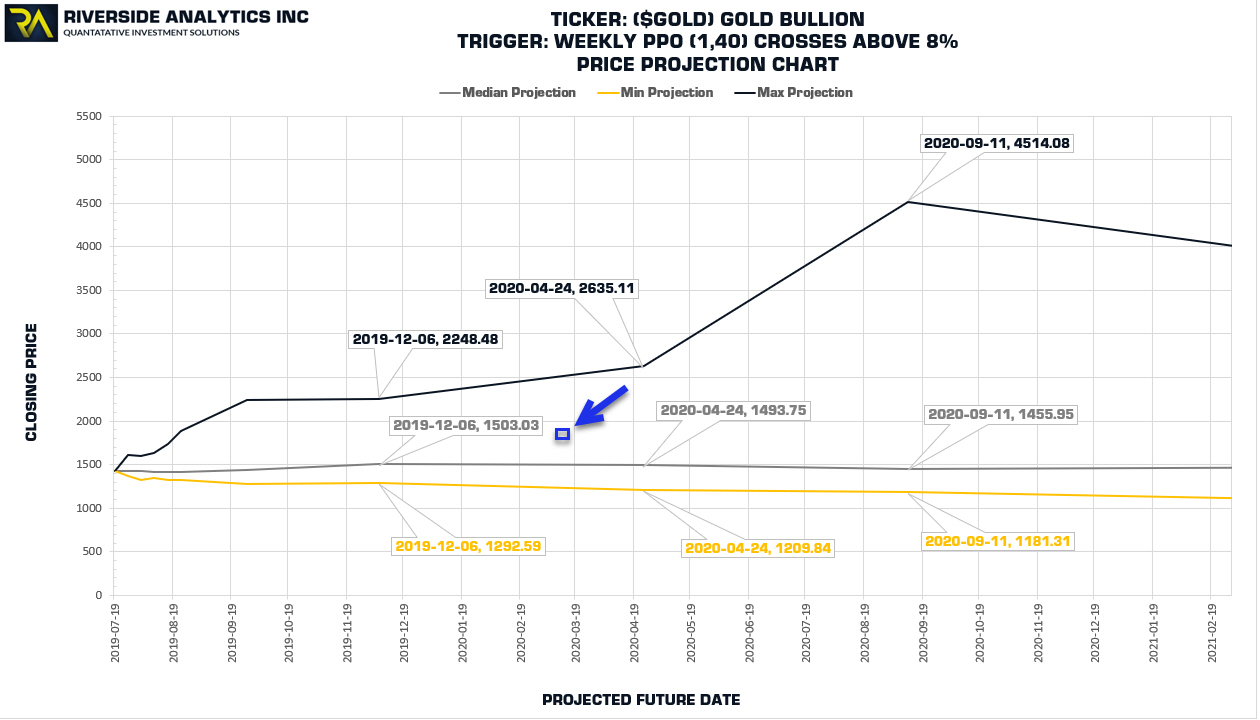
PRICE PROJECTIONS
The following chart illustrates the Minimum, Median and Maximum price projections up to 1-Year Following the original signal. As of the close on February 25, 2019, price action currently resides between the Median and Maximum Price Projection lines (shown by the blue arrow) where by illustrating that Gold remains a favored asset in today’s market.
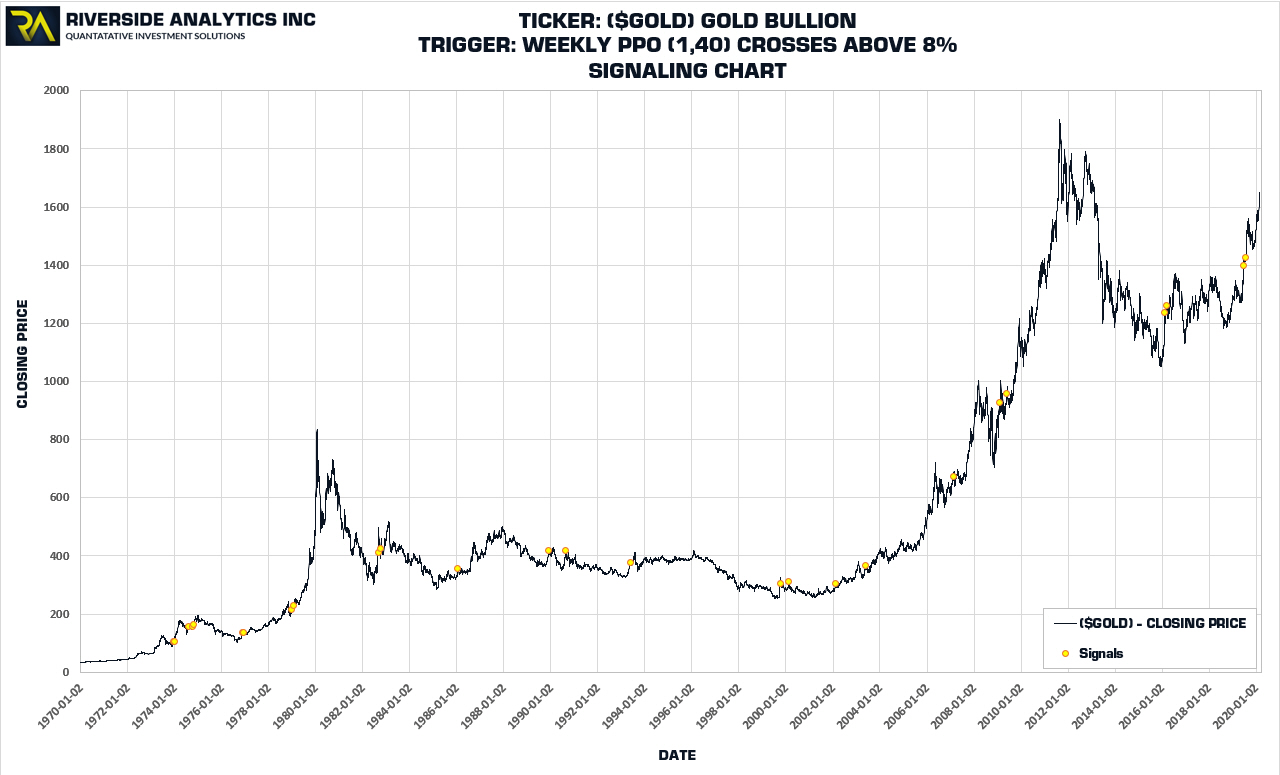
HISTORICAL SIGNALS
The following illustrates the historical signals of where the weekly PPO(1,40) on $GOLD exceeded 8% from 1970 to 2019.
DRAW DOWN ANALYSIS
The following chart illustrates the calculated Drawdown ranges for look back periods of 3-months, 6-months and 1-year time frames.