2020-02-25 Market Update
LISTENING TO THE MARKET – THE WARNING SIGNS
On February 23, 2020 , in our Weekend Market Update, we indicated that while the Trend and Market Breadth indicators resided in a longer term NET Bullish Posture, we were seeing cracks in the market’s armor. The quote below is directly from our February 23, 2020 update.
“We note that while the S&P 500 has been rising into the February 2020 highs, market breadth has NOT supported this rise. This is one of the clues the market has provided to indicate that we should be open to some shorter term market volatility and declines in the coming weeks.”
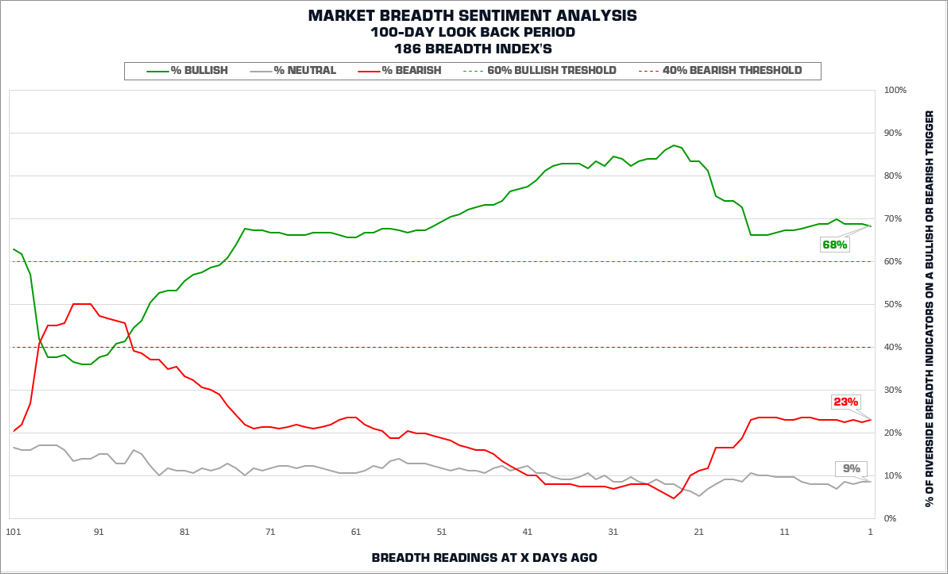
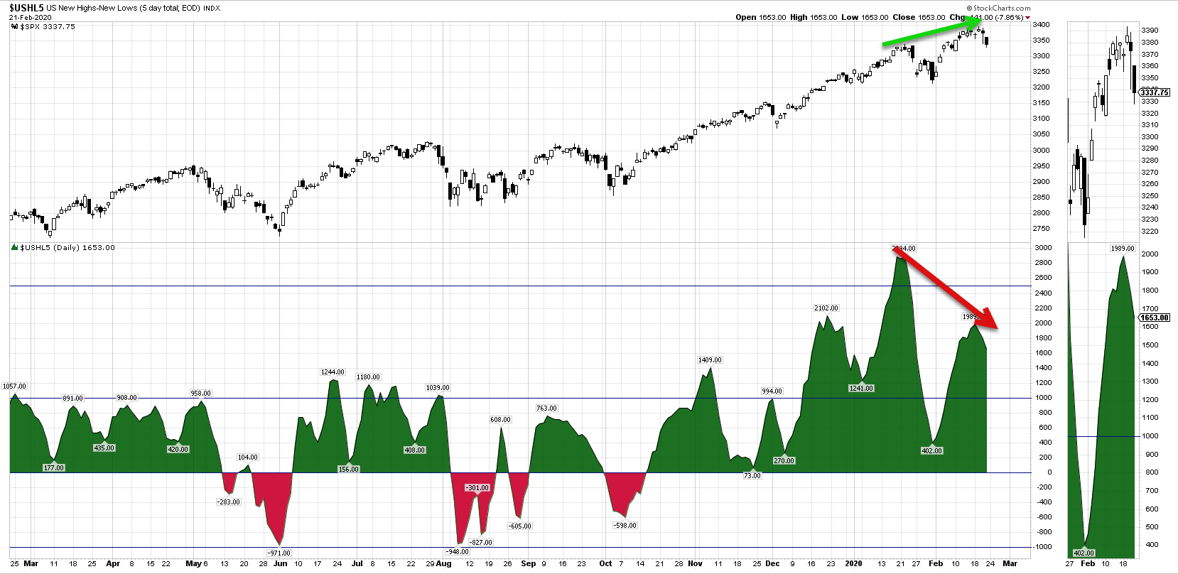
Below are the two charts illustrating the Breadth Divergences we noted in our February 23, 2020 Weekend Market Update.
RIVERSIDE’S MARKET BREADTH SENTIMENT ANALYSIS – FEBRUARY 21, 2020
US NEW HIGHS – NEW LOWS INDEX ($USHL5) – FEBRUARY 21, 2020
PROTECTION POINTS
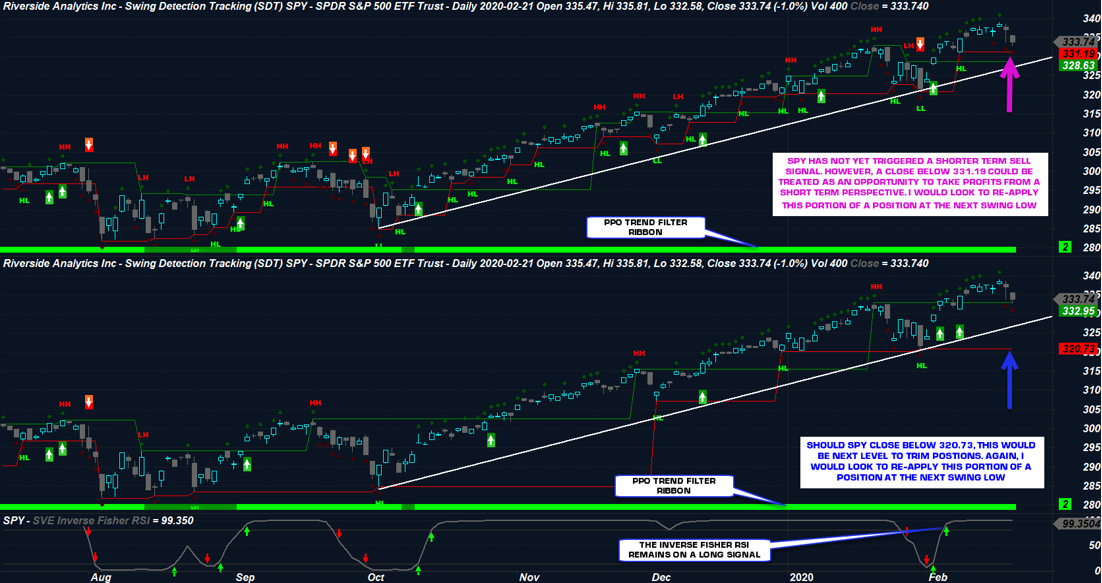
While noting the divergences in Breadth, we provided two key levels in our February 23, 2020 Weekend Market Update to trim or protect profits on longer term positions as illustrated below;
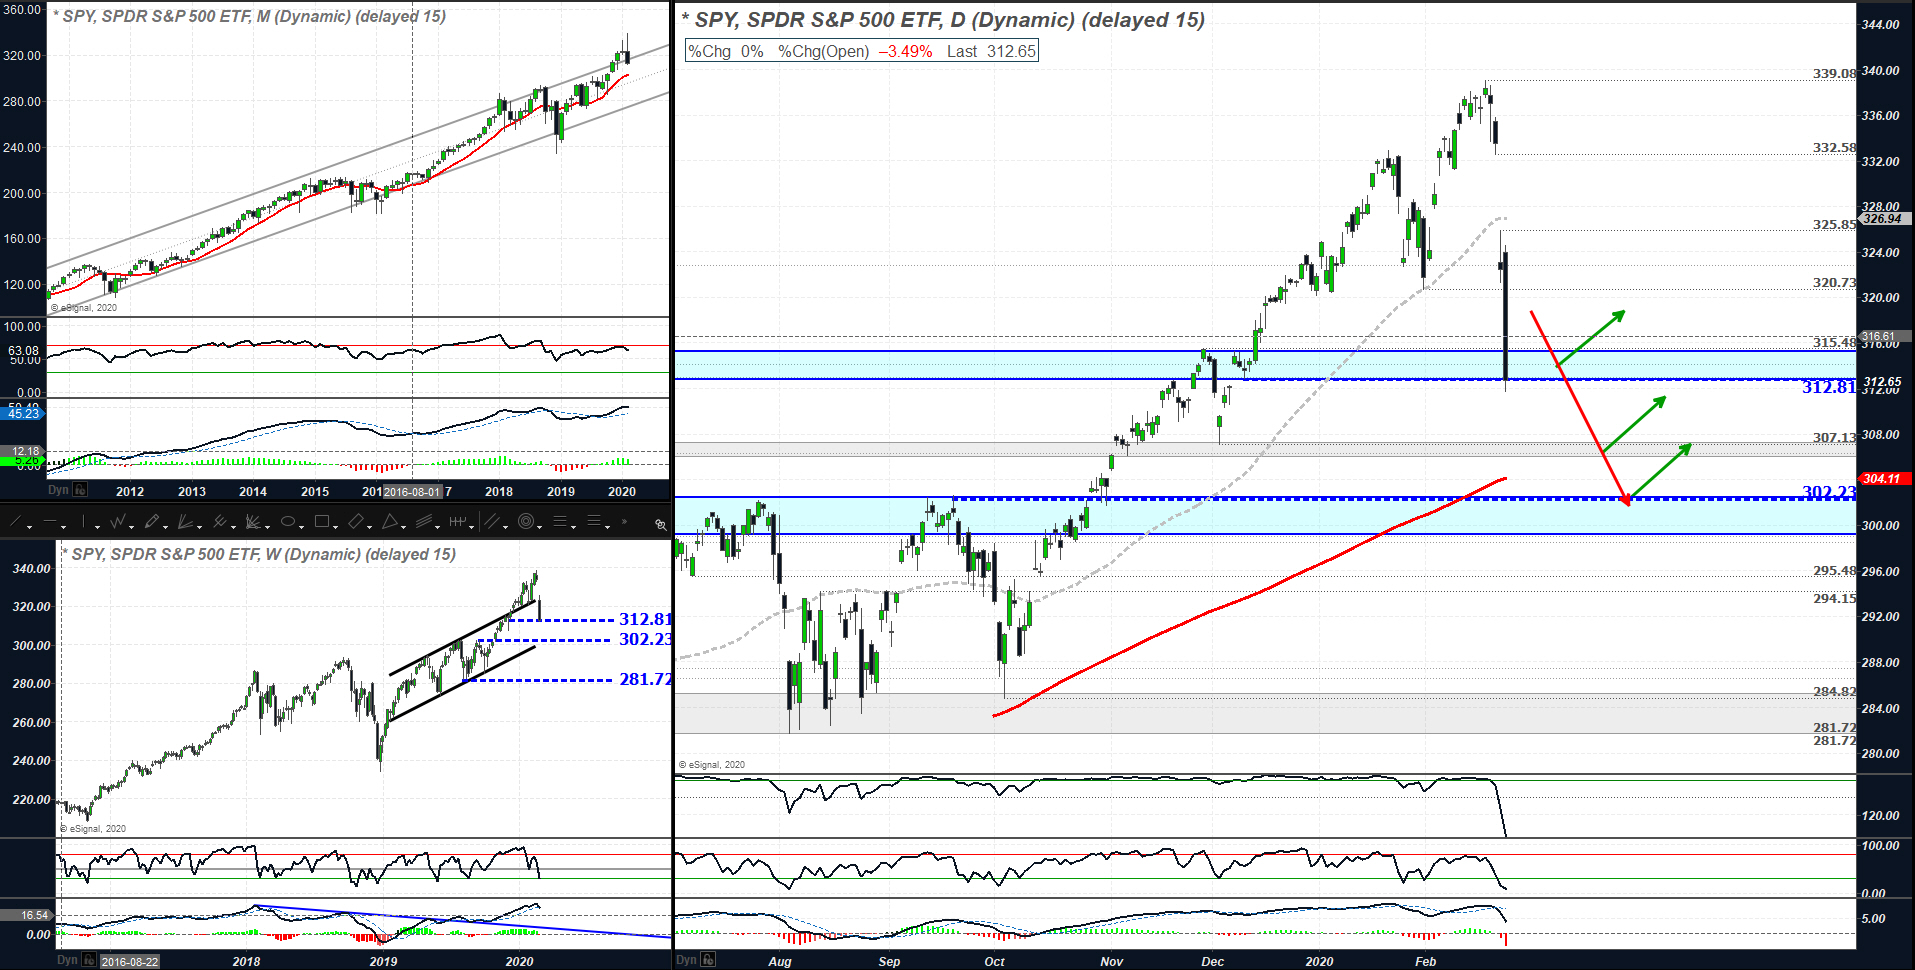
SPY – RIVERSIDE SWING DETECTION TRACKING – FEBRUARY 21, 2020
WHERE ARE WE NOW?
As of the close on February 25, 2020 the S&P 500 closed down – 7.3% from it’s February 19, 2020 high;
SPY – DRAWDOWN – FEBRUARY 25, 2020
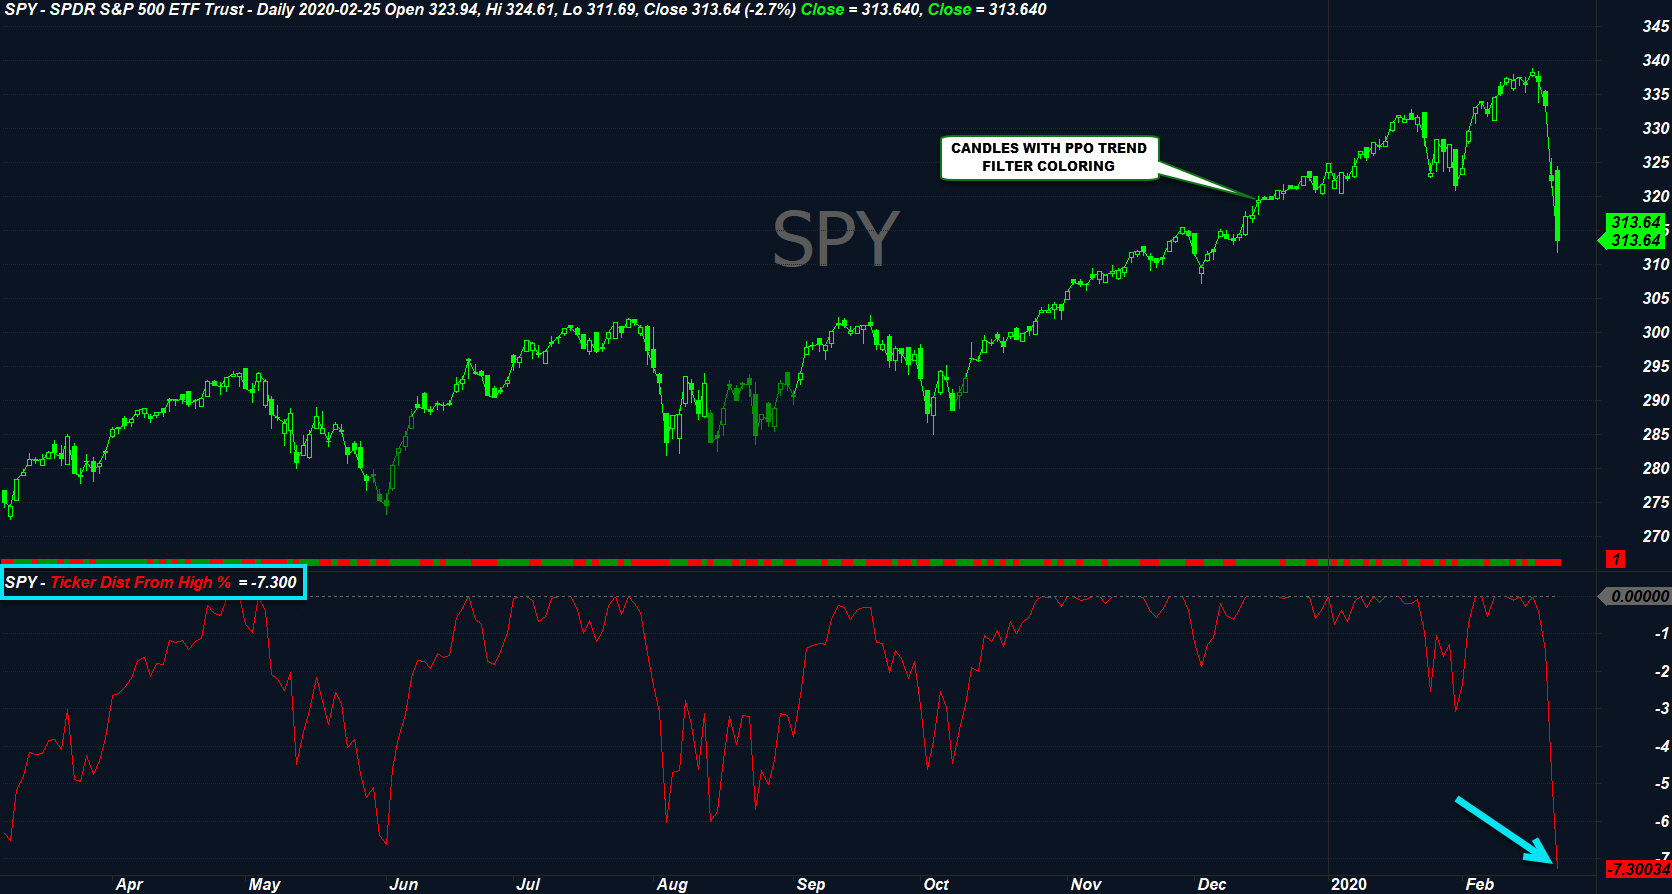
Based on the current close of 313.64, this close triggered both trim/protection levels as previously noted. While a -7.3% Drawdown is anything but comfortable, we must discern between volatility to ignore vs volatility to respect. The chart below illustrates the historical weekly drawdowns on the S&P 500 Large Cap Index ETF (SPY) from 1993 – 2020.
SPY – HISTORICAL DRAWDOWN ANALYSIS – FEBRUARY 21, 2020
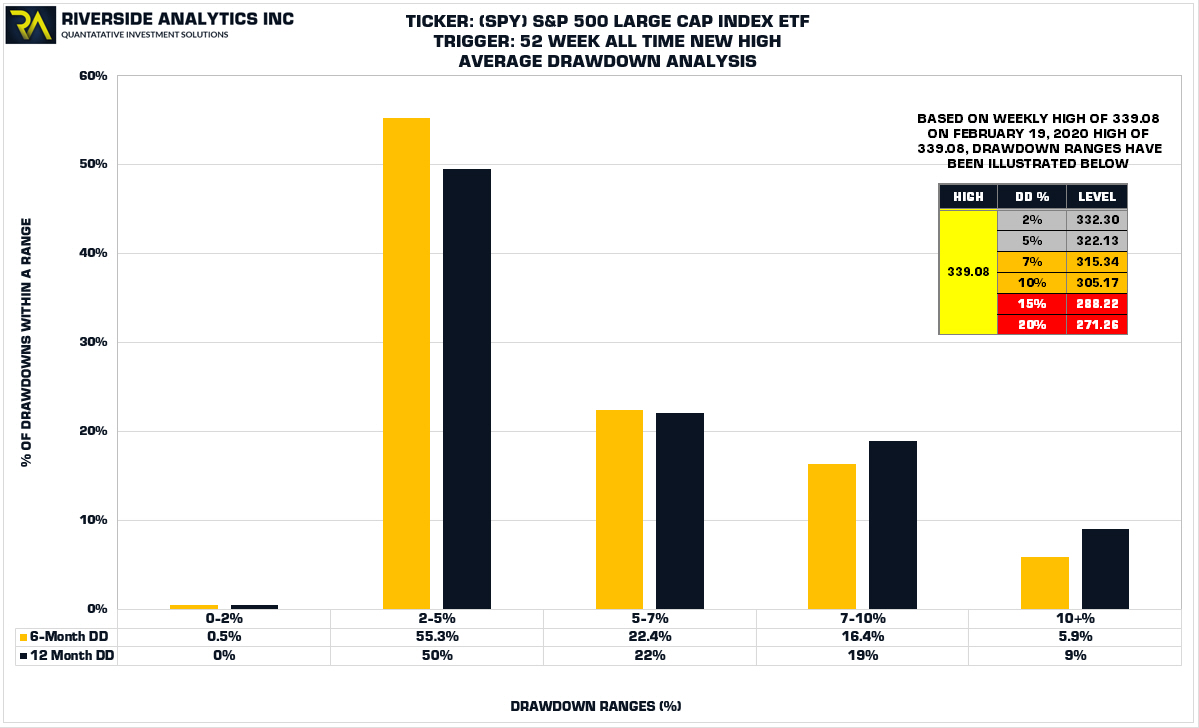
As you can see, 6-months following an all time high, 55.3% of all drawdowns fall within the 2-5% range and 22.4% of all drawdowns fall within 5-7% range. Currently at a drawdown of -7.3%, I would still classify this drawdown as being in the “Normal” range of historical drawdowns.
If we look at the data another way, 94.6% (0.5 + 55.3 + 22.4 + 16.4) of all drawdowns occur within 10% of the all time highs. From a longer term perspective, these are the drawdowns we want to make sure we care careful with in not making too many longer term changes to our investment portfolios. However, that pesky 5.9% of Drawdowns exceeding the 10% threshold are the ones we want to try and avoid.
PORTFOLIO SHIELD – MARKET BREADTH AND TREND
As of the close on February 25, 2020, four out of the eight breadth indicators we track on the S&P 500 have turned bearish. This means that we now have four indicators on a bearish trigger and four remaining on a bullish trigger. Therefore Market Breadth at the S&P 500 level is now NET NEUTRAL.
SPY – RIVERSIDE MARKET BREADTH – FEBRUARY 25, 2020
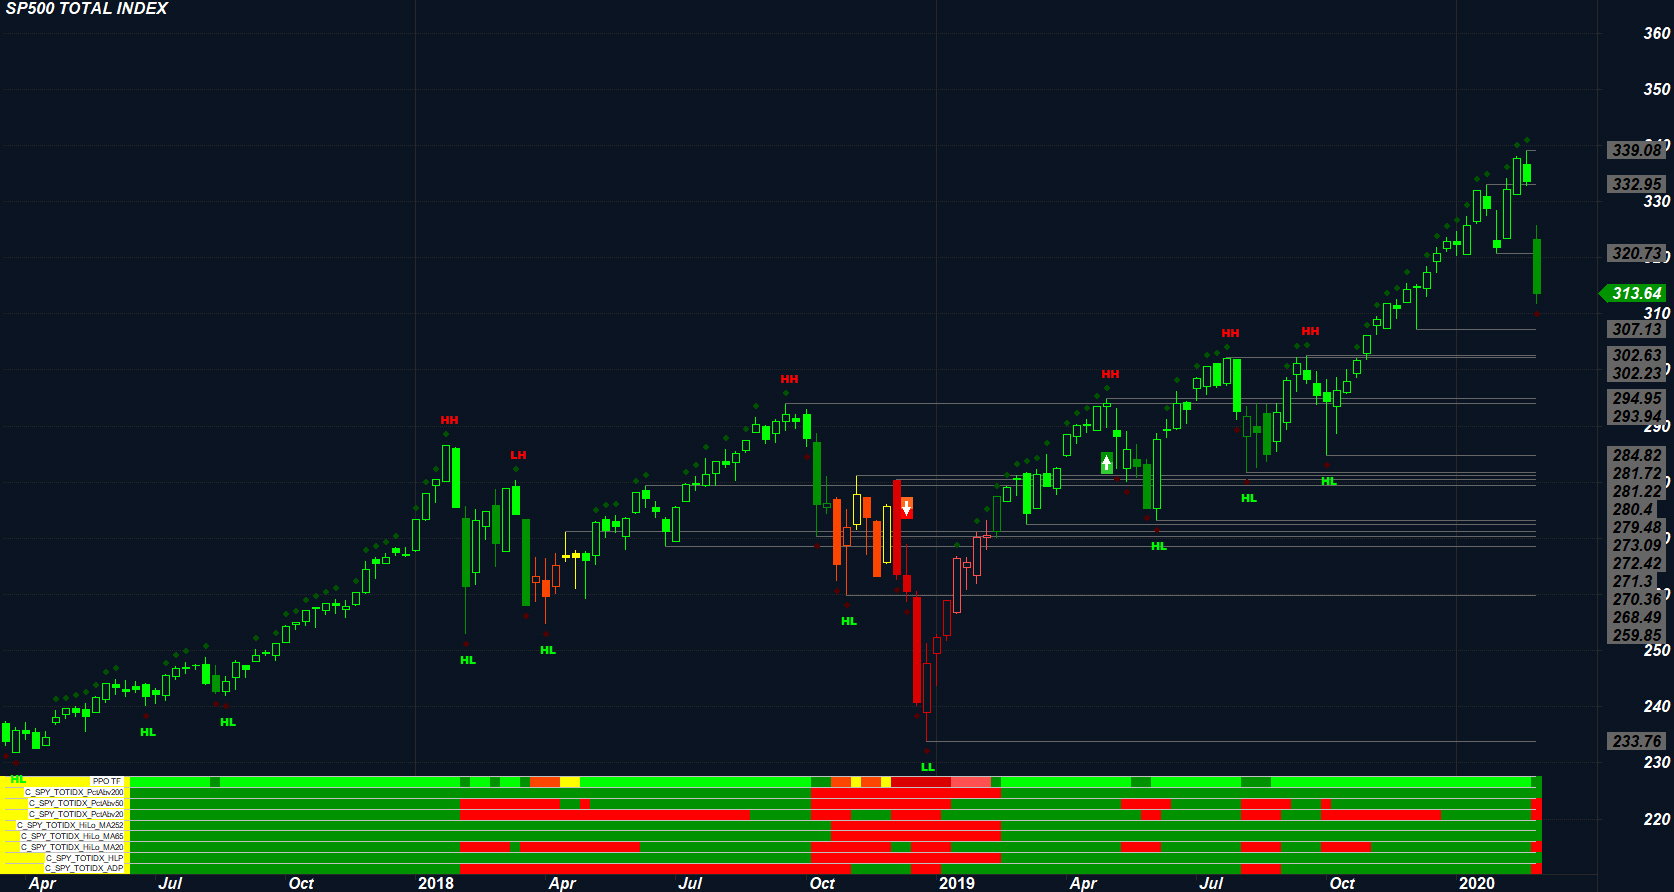
From a Trend Perspective, the green coloring on the weekly candles illustrate that the larger trend in the market remains in an uptrend and therefore the trend is NET BULLISH.
In combining both Market Breadth and Trend, the Portfolio Shield perspective, as neither Breadth or Trend has turned Bearish, the longer term Weight of the Evidence, despite the recent drawdown, continues to remain NET BULLISH at the S&P 500 level. As the Portfolio Shield remains NET BULLISH, I remain open to treating both pull backs and breakouts as opportunities. This thesis can and will change should we lose either signal. However, these signals are binary signals. While they are bullish, they are bullish until they are not. While they are bearish, they are bearish until they are not.
SPY – TRIPLE TIMEFRAME ANALYSIS – FEBRUARY 25, 2016
The current levels on SPY that I’m watching are as follows;
- Shield Screen: Pass
- Shield Position Size: Full Positions
- Strategy CDN ETF = XUS-TC
- Inverse US ETF = SH
- Dividend yield: 1.79%
- Momentum Add North of; $320.73, $325.83
- Value Add at a bounce of support at; $312.81, $307.13, $302.23
- Stops – Chand Exits (> 9) or ATR offsets;
As mentioned, I’m continuing to view this pullback as an opportunity, however, I will be waiting for the market to regain it’s footing in the next few days prior to initiating or re-building positions. I will provide further updates moving forward in time with opportunities I’m watching and/or transacting.
” I will invest in the market we are given, not the one I think it is, or it should be”
Tim Koen, P.Eng
President
Riverside Analytics Inc