2020-03-10 S&P 500 – Looking for a Bounce
The recent decline in the S&P 500 has been one of the fastest declines in history. As of the close on Monday March 9, 2020, the S&P 500 has declined in excess of -19% from its February 19th, 2020 high.
A recent article in the Financial Post was brought to my attention regarding severe historical drawdowns;
https://business.financialpost.com/investing/investing-pro/markets-are-fearful-and-history-tells-us-that-means-the-time-to-buy-is-right-now
In this post I have attempted to replicate the results of the Financial Post article with a few new chart templates we are working on here at Riverside.
CHART SETUP
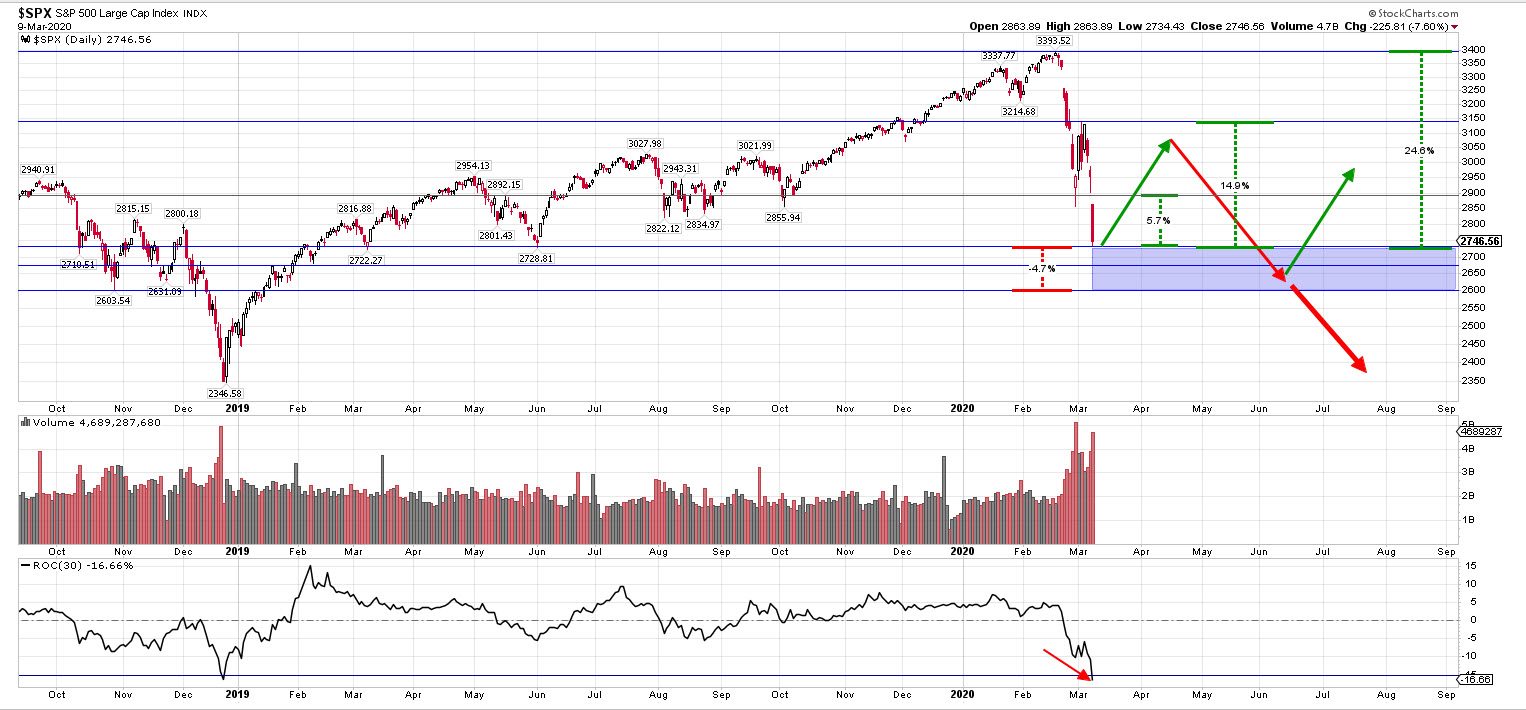
The following chart of the S&P 500 Large Cap Index ($SPX) illustrates the recent decline in the S&P 500 and the magnitude of the decline over the past 30-days measured by the Rate of Change Indicator (ROC).

At the close on Monday March 9, 2020, the S&P 500, 30-day ROC, crossed below -15%. The results that follow in this post, illustrate historical instances in time of when selling pressure of this magnitude has occurred and what has happened up to one year following the original signal.
BACKTEST SUMMARY – GENERAL
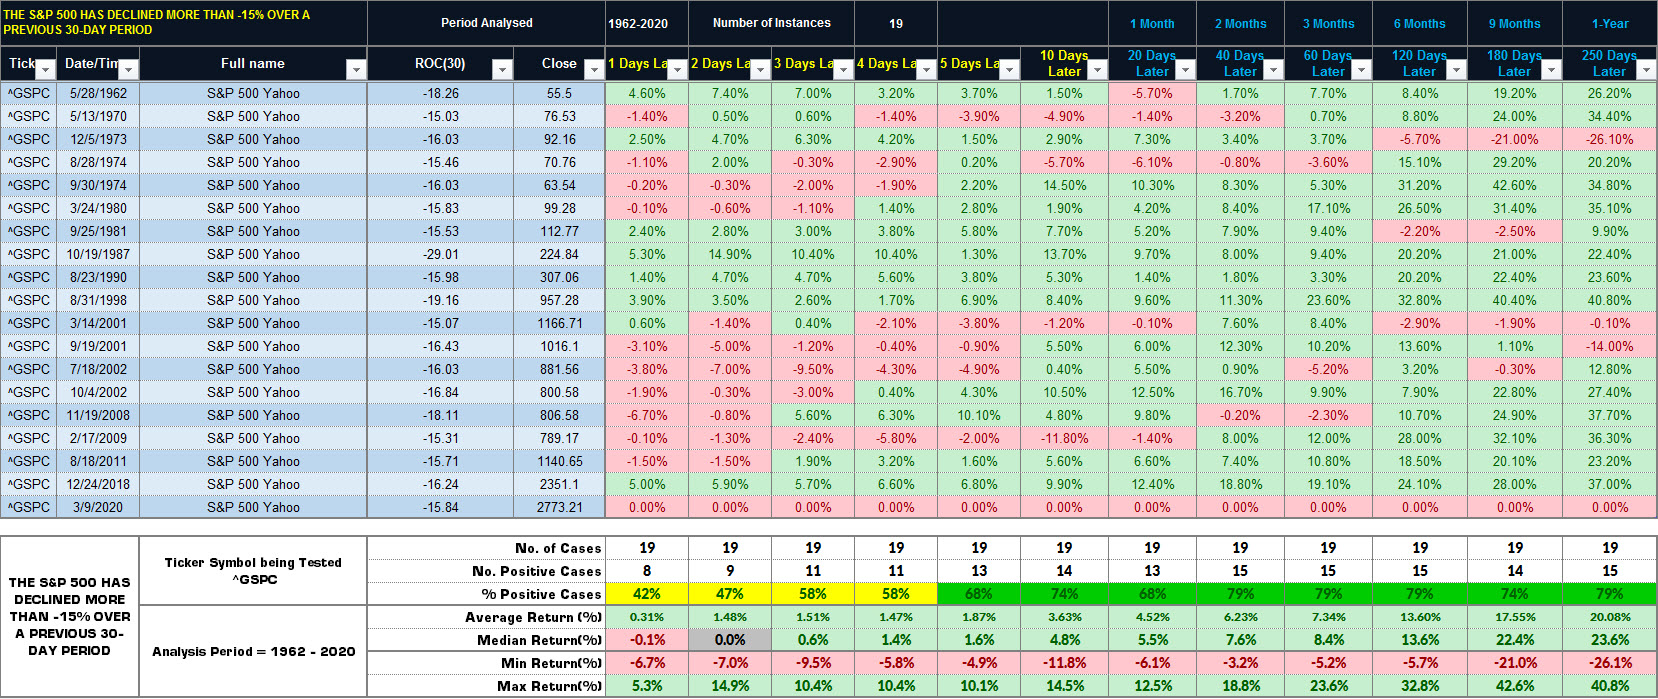
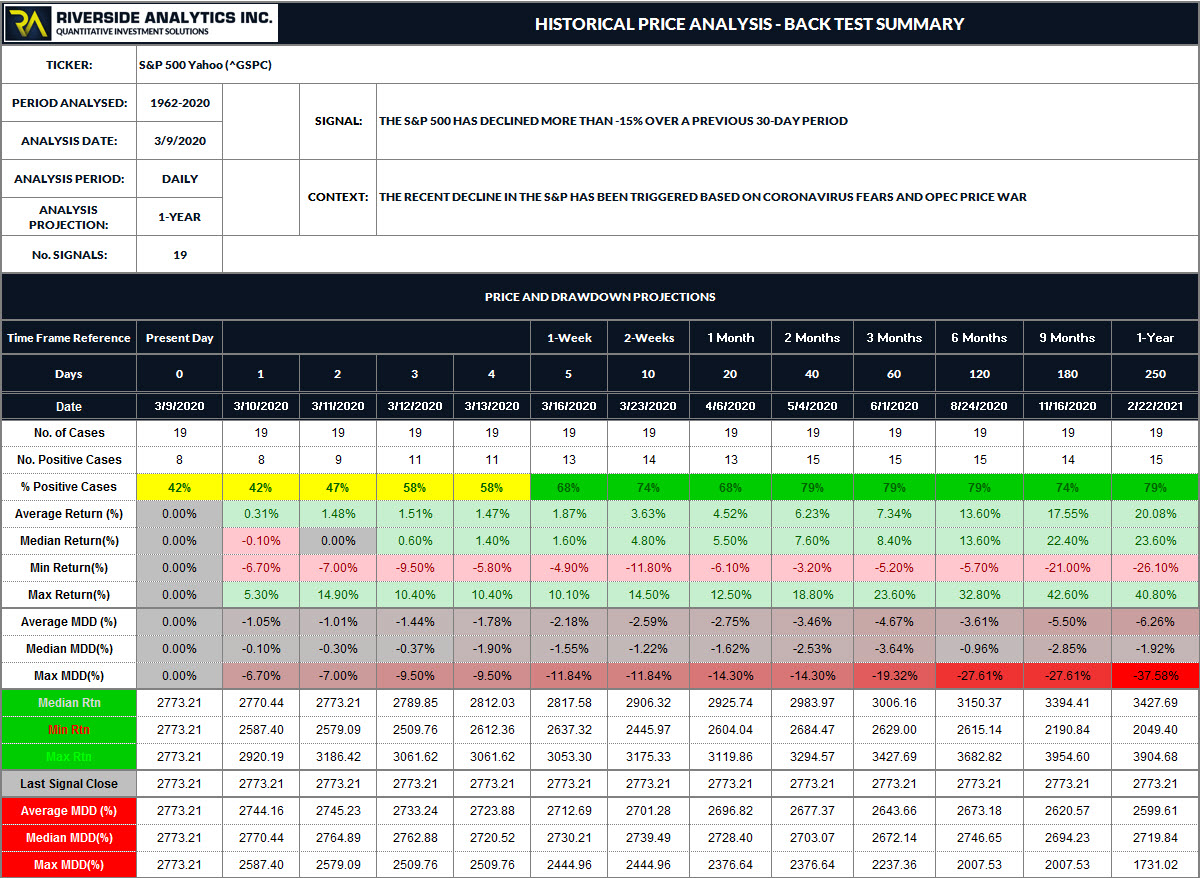
The following chart illustrates the results of the historical backtest on the S&P 500 Large Cap Index (^GSPC) . This backtest has been completed using Amibroker and historical price data from Yahoo Finance.
BACKTEST SUMMARY – DETAILED
SHORT TERM TIME FRAME ANALYSIS (UP TO 1-MONTH FOLLOWING THE ORIGINAL SIGNAL)
The number of positive cases have been observed to range between 42-74% with median returns of up to 5.5%. Average Drawdowns in this time frame have been calculated up to -2.75%, while Maximum Drawdowns up to -14.30% have also been noted.
MID TERM TIME FRAME ANALYSIS (1-MONTH TO 6-MONTHS FOLLOWING THE ORIGINAL SIGNAL)
The number of positive cases have been observed to range between 68-79% with median returns ranging from 5.5 to 13.60%. Average Drawdowns in this time frame have been calculated up to -4.67%, while Maximum Drawdowns up to -27.61% have also been noted.
LONG TERM TIME FRAME ANALYSIS (6-MONTHS TO 1-YEAR FOLLOWING THE ORIGINAL SIGNAL)
The number of positive cases have been observed to range between 74-79% with median ranging from 13.60 to 23.60 %. Average Drawdowns in this time frame have been calculated up to -6.26%, while Maximum Drawdowns up to -37.58 % have also been noted.
ANALYSIS CONCLUSIONS
Based on the above historical backtest results, there have been more cases where bounces have occurred following large sell off’s in the past than further declines. However, the backtest results also illustrate that average further declines of -4.67 to -6.26% up to one year following the original signal would be considered Normal.
Translating this downside range onto the current chart of the S&P 500, would place a potential second bottom between the current low of 2734 down to 2600 as shown below;
In further posts in the next coming weeks, we will be providing details on successfully navigating Drawdowns from an Investment perspective. The remaining charts in this post provide a visual representation on the various back test metrics.
“I will invest in the market we are given, not the one I think it is, or it should be”
Regards,
Tim Koen, President
Riverside Analytics Inc.
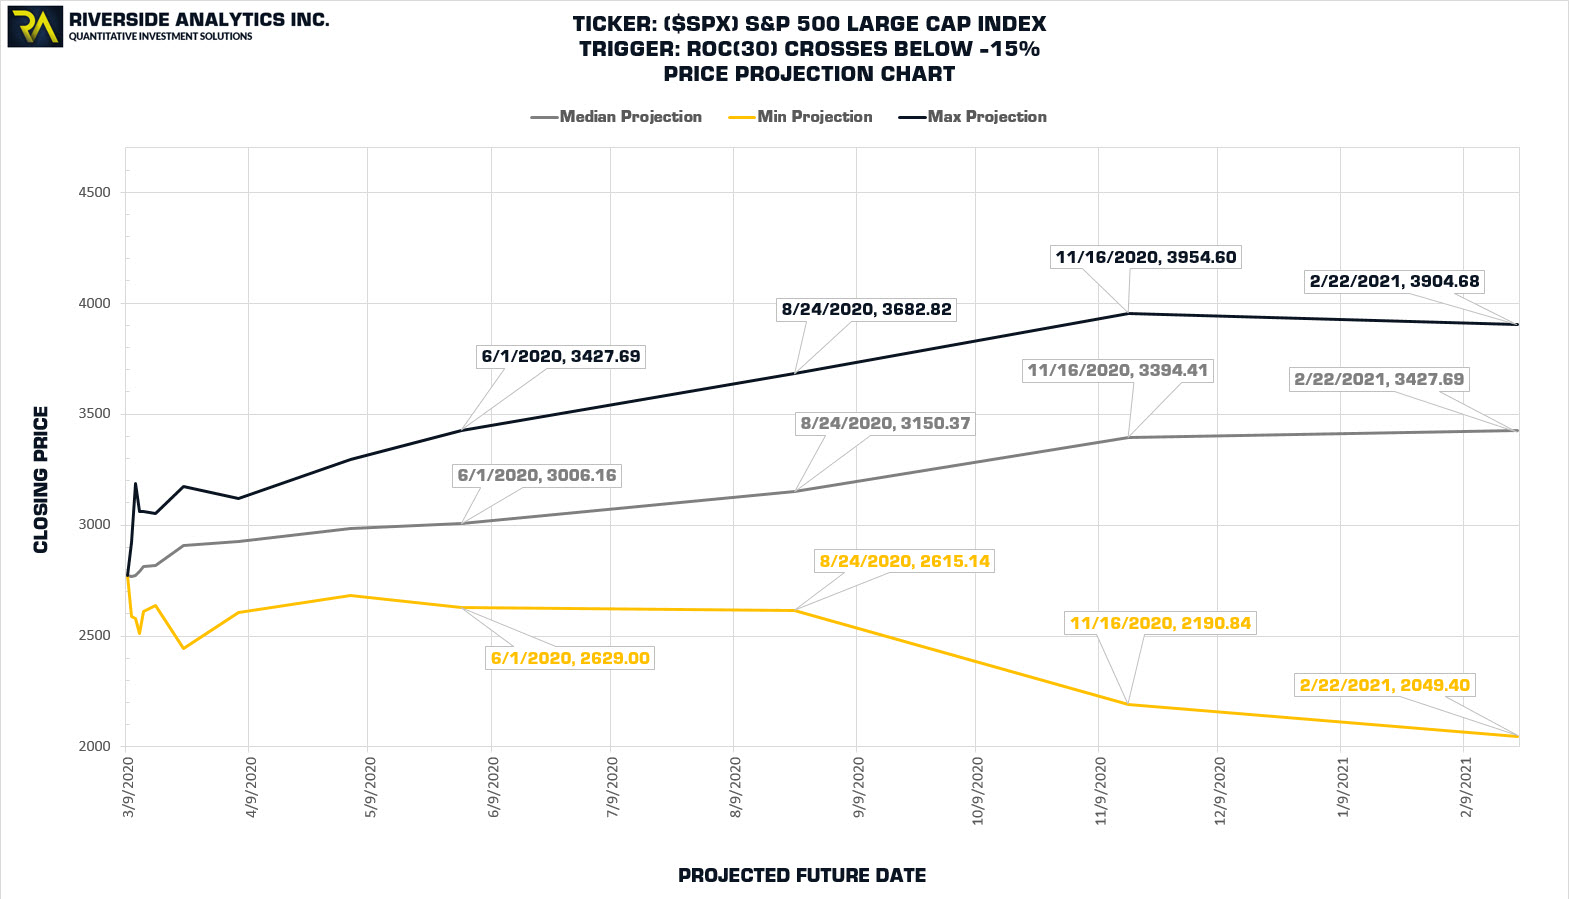
PRICE PROJECTIONS
The following chart illustrates the Maximum, Median and Minimum projected price targets for 2020 based on the Detailed backtest results illustrated above.
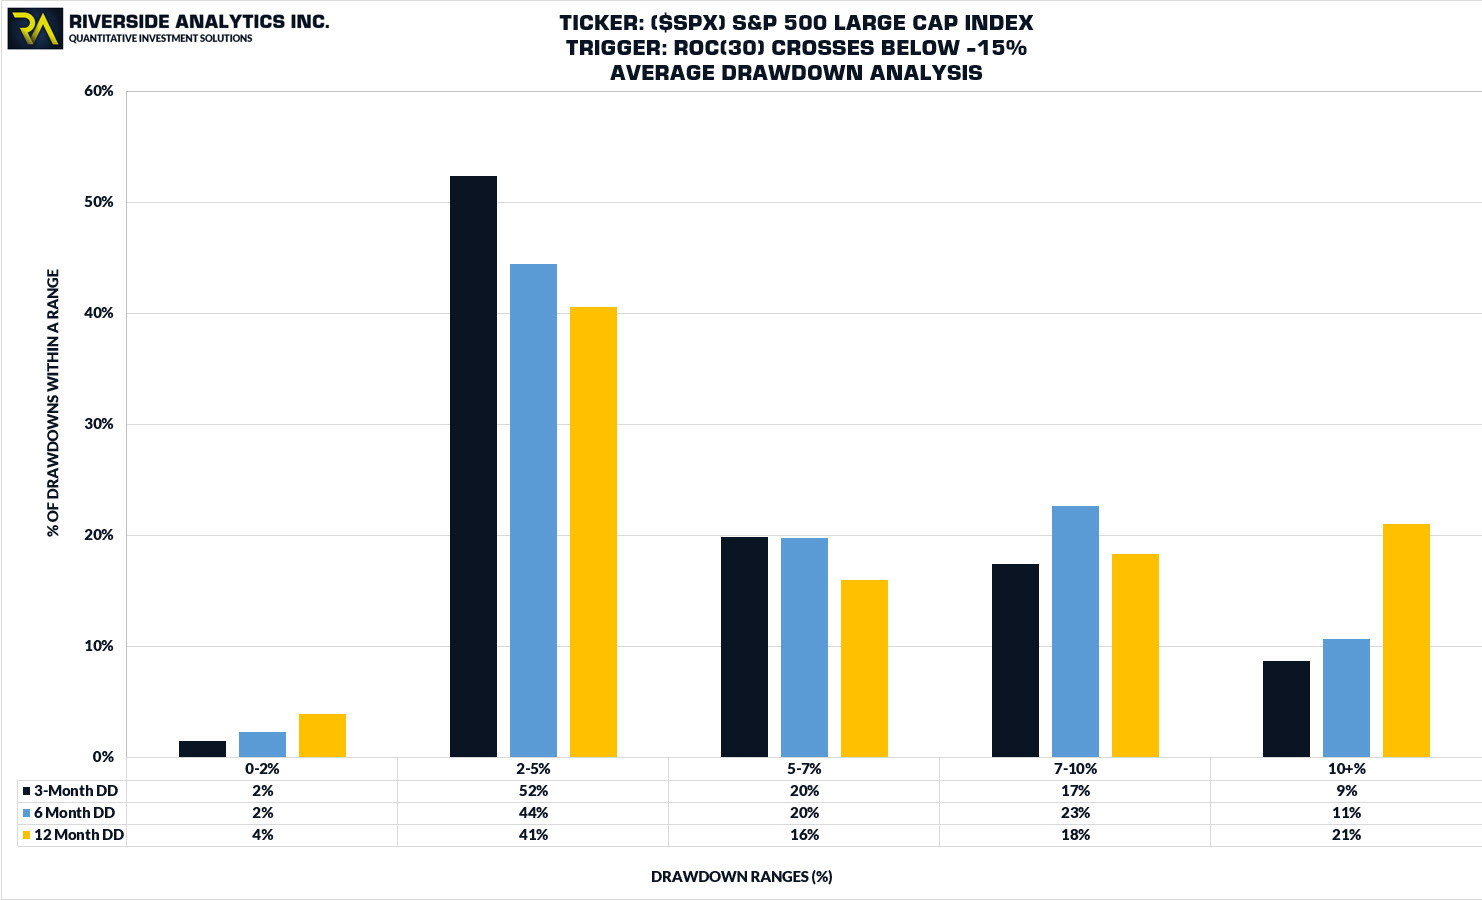
AVERAGE DRAWDOWN ANALYSIS
The following chart illustrates the Average Drawdown Analysis based on the Detailed backtest results illustrated above.
HISTORICAL SIGNALS
The following chart illustrates the historical cases of where the market has declined more than -15% over a prior 30-day period.
